Equilibration of the Extra-Tropical Atmosphere and Southern Ocean by Macroturbulence
story by Malte Jansen and Helen Hill


Figure 1: Temperature at 1000 hPa (top panel) and SST (bottom panel) between ~ 30 and 60 degrees South – image source: M. Jansen
Malte Jansen is a third year graduate student in PAOC at MIT. He has been using MITgcm in an idealized study to explore how mixing by eddies may influence the equilibrium state of the extra-tropical atmosphere and the Southern Ocean and in particular why the two regimes exhibit such a different equilibrium state. His advisor is Raffaele Ferrari.
Figure 1 shows the surface temperature (at 1000 hPa) in the (extra-tropical) atmosphere (top panel) and in the Southern Ocean (bottom panel), the sea surface temperature over broadly the same region in the southern hemisphere. The biggest difference is the size of the eddies: In the atmosphere there are just a few large eddies, while the ocean teams with many, many, much, much smaller eddies. The key to why this should be is that the scale at which the instabilities occur that cause these eddies, the deformation radius, is much smaller in the ocean.
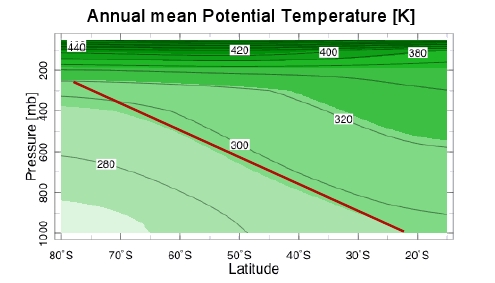
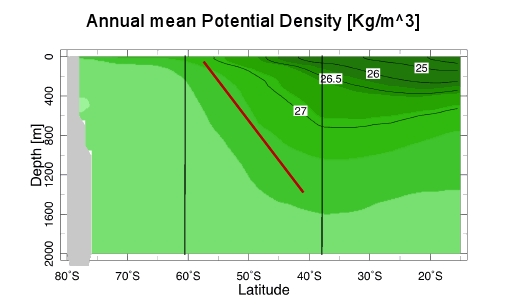
Figure 2 compares the corresponding vertical structure in each of the two fluids:
Figure 2(a) shows the time and zonal mean potential temperature as a function of latitude and height in the southern hemisphere extra-tropics. The isentropes slope upwards toward the pole (to the left) with a slope that scales roughly like the height of the tropopause over the meridional extent of the mid-latitude baroclinic region, which in turn scales roughly like the radius of the Earth. This is in agreement with 2-layer QG theory which predicts isentropic adjustment to a marginal criticality condition having the observed slope.
Figure 2(b) shows the corresponding time and zonal mean potential density as a function of latitude and height over the same latitude band in the Southern Ocean. In this case the isentropic slope is significantly steeper than predicted suggesting a super-critical mean state. That this is so is also supported by other observations which suggest that the mean state of the Southern Ocean is strongly supercritical to baroclinic instabilities.
Why does “Baroclinic Adjustment” not hold in the Southern Ocean? What is different?
Two obvious differences are:
- Differences in Eddy Scale: As seen in Fig. 1, the eddy scales are much smaller in the Southern Ocean – and in particular the Deformation Scale is much smaller – and unlike in the atmosphere much smaller than the domain scale.
- Differences in Forcing: While the ocean circulation is mostly mechanically driven, the atmosphere can be understood as a heat engine driven by internal diabatic heating and cooling.
Malte’s work has been focussing on the first difference. He shows that by varying the deformation scale (which sets the scale at which eddies are produced by baroclinic instability) Marginally critical states (as observed in the atmosphere) as well as supercritical states (as observed in the ocean) can be obtained.
Model Set-Up.
Malte used a Cartesian version of MITgcm configured as a zonally re-entrant, channel. Noting that Ld ∝ √ ( g α Δv Θ H & ) ⁄ f ) (where α is the thermal expansion coefficient, Δv Θ is the vertical temperature difference over the depth of the fluid), by varying the thermal expansion coefficient between 1.2×10⁻⁴ K-1 and 1.4×10⁻² K-1, Malte explored deformation scales ranging from 250 to 3500km.

Figure 4: Snapshots of surface temperature in the 2 end-member experiments – There are large (domain scale) eddies in the limit of the largest thermal expansion coefficient, while the scale of the turbulence clearly decreases when alpha is reduced – image source: M. Jansen
Domain dimensions were 300 x 180 x 29 grid points with a horizontal grid-length of 50m and a vertical grid-length of 400m through the top ~9km, falling to 50km at the surface, creating a flat-bottomed channel 15000km long by 9000km wide with a depth of 10km. The time step ranged between 60s (for the largest thermal expansion coefficients) and 600s (for the smallest). The model had free-slip sides, with implicit diffusion to represent convection. Initially at rest with a homogeneous temperature, the model was forced by diabatic heating, realized as a thermal restoring to mimic the effects of radiation in the atmosphere. Malte used 2nd order temperature advection and a linear equation of state.
Results

Figure 5: End-member solutions for runs with different thermal expansion coefficients – zonal velocity (m/s) is colored with isentropes superimposed in gray. The red lines denote the isentropic slope – source: M. Jansen.
Figure 5 shows the time and zonal mean states for the 2 end-members from Malte’s series of runs with different thermal expansion coefficients. The figure on the left corresponds to the run with the largest expansion coefficient (ie the more atmosphere-like run) while the one on the right corresponds to the run with the smallest (ie the more ocean-like). It can be seen that as the thermal expansion coefficient falls and the fluid becomes less like Earth’s atmosphere and more like the ocean the isentropic tilt changes from being consistent with marginal criticality, ie going from surface to tropopause over the domain, to being significantly steeper, corresponding to a super-critical mean state.
Theory/ Scalings
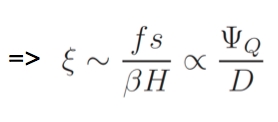
Neglecting friction, with a diffusive closure, it can be shown that the isentropic overturning circulation ψQ ≈ D s (where D is the eddy diffusivity and s is the isentropic slope). This yields for the isentropic slope s ∼ψQ ⁄ D. Since the tropopause height doesn’t change very much (ie H ≈ constant) and f and β are fixed, the criticality parameter itself is primarily proportional to the isentropic slope and therefore expected to scale as the residual overturning over the eddy diffusivity: For Malte’s range of α (Figure 6, below) the above scaling holds well.

Figure 6: Testing scalings – Isentropic slope plotted against the ratio of the isentropic overturning circulation to the eddy diffusivity – source: M. Jansen
Going a step further towards understanding what sets the overturning and the eddy diffusivity and why the ratio increases in the simulations with small expansion coefficients Malte then made a closure for the eddy diffusivity based on Held and Larichev, 1996. Doing this would suggest that the eddy diffusivity is proportional to the cube of the criticality times the cube of the deformation scale ie
Since, in addition, the diabatic overturning turns out to be a constraint on the thermodynamic equation and can be shown not to have any direct dependence on the thermal expansion coefficient and therefore varies much less than the eddy diffusivity (which depends directly on alpha via its dependence on the deformation scale), substituting this relationship back into the expression above, suggests that the criticality parameter would be expected to scale as the deformation scale to the -3/4.

Figure 7: Testing scalings – Isentropic slope plotted against the ratio of the deformation radius to the domain scale. The red line denotes a power law with an exponent of -3/4 – source: M. Jansen
Figure 7 above (showing ξ plotted against Ld/a, where a is the domain scale) tests this, demonstrating that in at least the more supercritical simulations (that is the simulations with small expansion coefficients and small deformation scales) the scaling is broadly supported by the numerical results. The scaling does break down in the limit of larger deformation scales where the criticality is close to one, but that is to be expected given that the underlying assumptions can’t be expected to hold in this limit. Instead what Malte finds is that the criticality in this limit depends less strongly on the thermal expansion coefficient and seems to asymptote towards a value close to one which would be in agreement with traditional ideas of baroclinic adjustment.
Conclusions
- Marginal critical and supercritical states are obtained in a diabatically forced channel model if the thermal expansion coefficient α is varied.
- As α and thereby Ld is reduced: Eddies becomes less “efficient” in modifying the mean state and
eddy-eddy interactions instead become stronger - For “large” Ld: criticality seems to asymptote towards ~1
Future Work
Malte is currently trying to understand better what is happening in the limit of large thermal expansion coefficients. In particular do classical ideas of baroclinic adjustment (e.g. vanishing PV gradient in the surface layer) apply in this scenario? This work has been submitted to the Journal of Atmospheric Sciences under the title “Macroturbulent Equilibration in a Thermally Forced Primitive What to know more? Contact Malte…
References:
Jansen, M. and R. Ferrari, Macroturbulent Equilibration in a Thermally Forced Primitive, Journal of Atmospheric Science (submitted)
Held, I. M., and V. D. Larichev (1996) A scaling theory for horizontally homogeneous, baroclinically unstable flow on a beta plane. J. Atmos. Sci., 53, 946–952, doi:10.1175/1520-0469(1996)053<0946:ASTFHH>2.0.CO;2


