Mapping the solutions
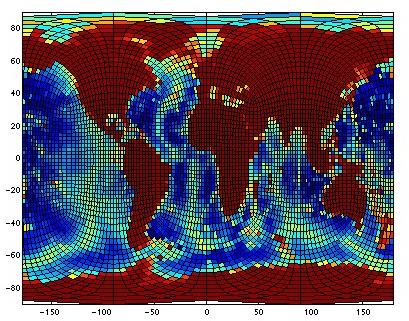
The cubic grids, like many curvilinear grids, produce unintuitive maps
between physical and computational space. A conventional projection
use for displaying spherical data is the mercator projection (shown
below). We've drawn the grid lines of the cubic grid on which the data
shown (bathymetry) was contained. It shows how the model coordinates
are oriented in arbitrary physical directions making analysis more
tricky. For instance, calculating a zonal average is trivial on a
regular lat-lon grid but no longer so on the cubic grids.
 To make life even more interesting, the most useful
pattern/orientation of storage with in computer memory is unintuitive
too. Below we show how the six faces of the cube are laid out in
memory with their particular orientations.
To make life even more interesting, the most useful
pattern/orientation of storage with in computer memory is unintuitive
too. Below we show how the six faces of the cube are laid out in
memory with their particular orientations.
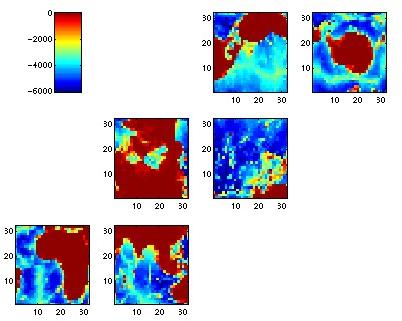 The North pole is in the the center of the third tile from the
bottom-left and with the Greenwich meridian pointing to the left. The
South pole is the upper-left most tile with the Greenwich meridian
pointing upwards. The equator spans the the two bottom most tiles from
left to right and then cuts upwards across tiles four and five.
The North pole is in the the center of the third tile from the
bottom-left and with the Greenwich meridian pointing to the left. The
South pole is the upper-left most tile with the Greenwich meridian
pointing upwards. The equator spans the the two bottom most tiles from
left to right and then cuts upwards across tiles four and five.