Using MITgcm to Model the Ocean’s Response to a Passing Hurricane
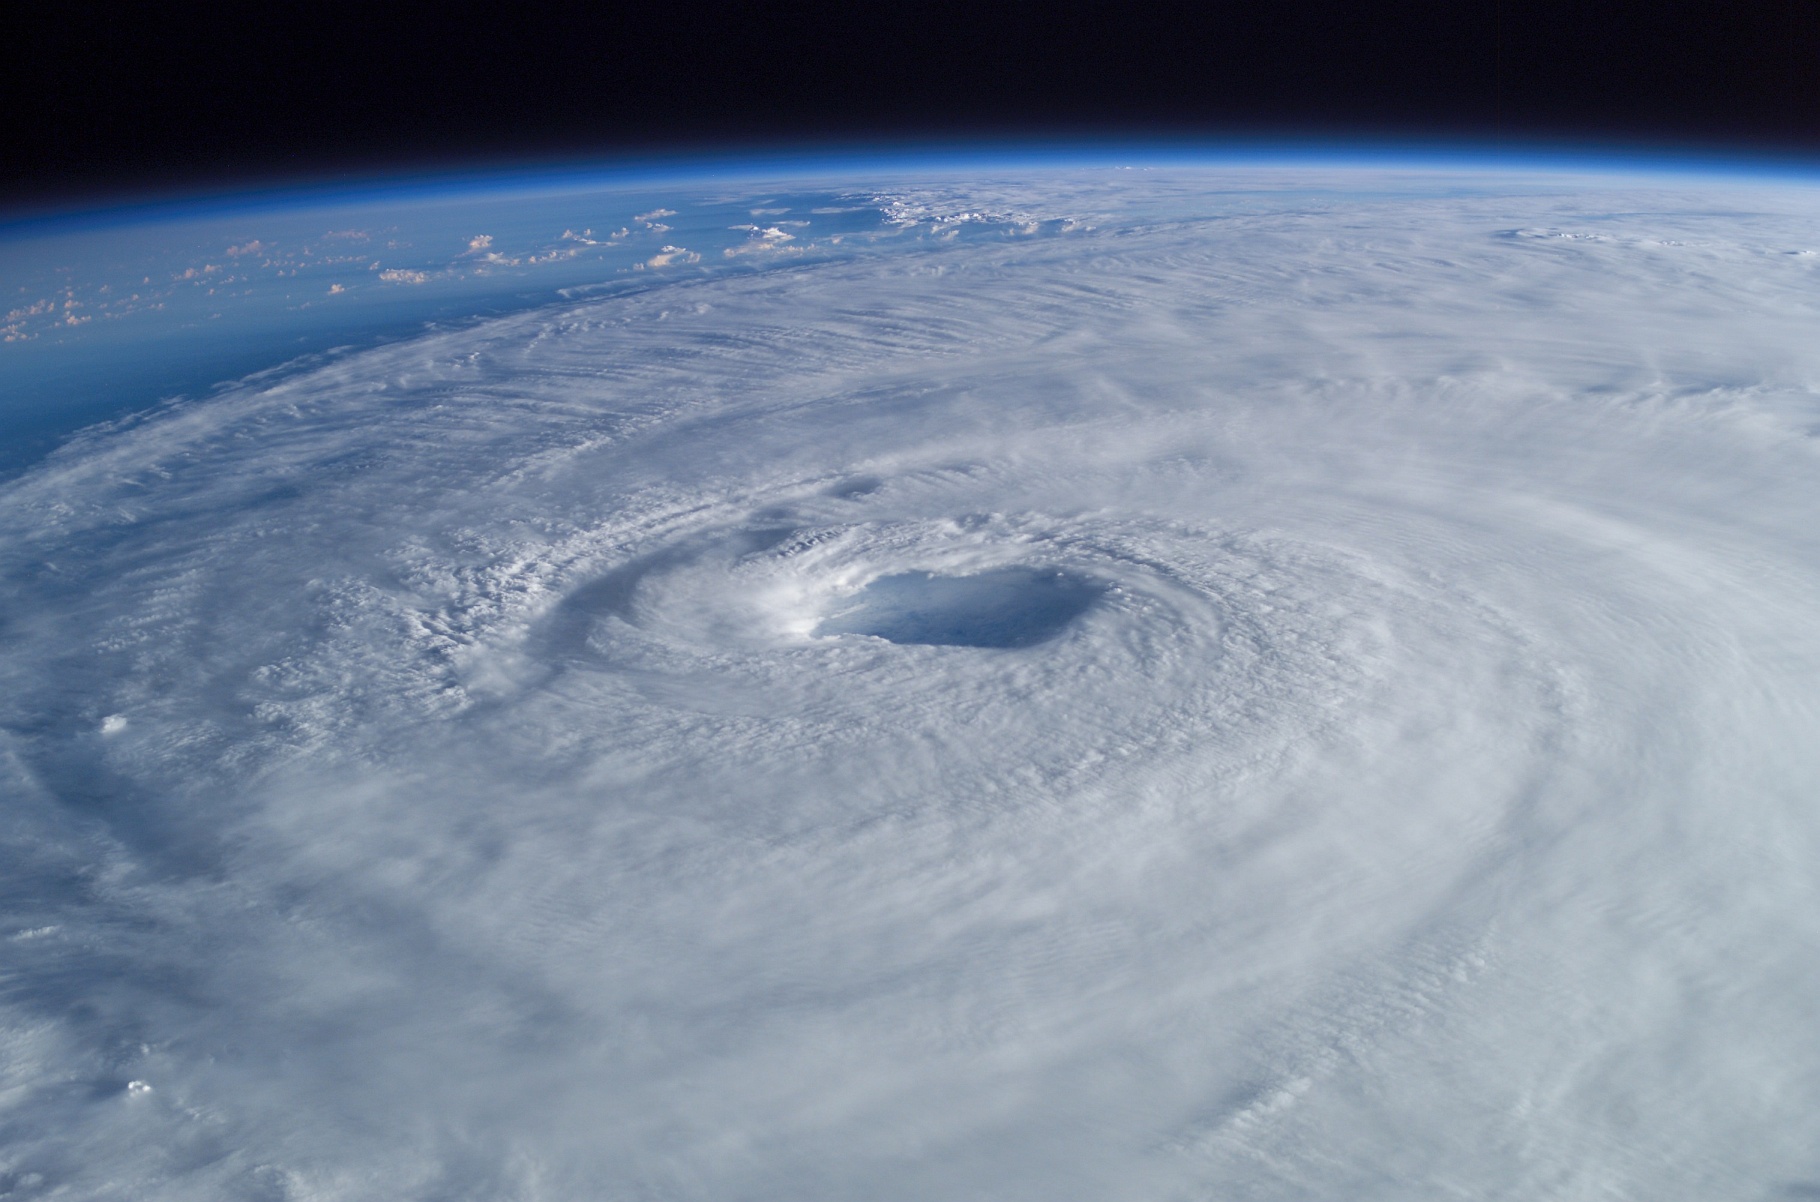
Helen Hill [1] and Sarah Zedler [2]Familiar as we are with satellite images of hurricanes, the impact of these powerful storms on the upper ocean is markedly less visible. Sarah Zedler [2], currently an IAMCS [4] Postdoctoral Fellow in the Math Department at Texas A&M University has been using MITgcm to help understand the features that appear in oceanic field data as a result of hurricane passage above.
Zedler’s interest is in medium scale wind forced high frequency dynamics and thermodynamics of the upper ocean, inertial currents and their interactions with background vorticity constraints, and processes at the the air-sea interface. The work reported here originated in her masters and doctoral thesis work which focused on strong wind forcing of the ocean, and more specifically the ocean’s response to hurricane passage above. As a postdoc, current areas of research include the inverse problem of using data assimilation to improve the representation of features in her models and working on making estimates of properties of the overlying wind field based on analyses of the ocean’s response. While this is not the first time the major features of the ocean’s response to a hurricane have been elucidated in a modeling study, it is (so far as we are aware) the first time such work has been accomplished using MITgcm. Classic hurricane ocean response modelling references would include eg. Greatbatch (1983), Price (1981) and Price (1983). Zedler is currently working on the general problem of using data assimilation in the MITgcm to estimate the drag coefficient parameterization with wind speed that is consistent with the ocean response.
Observed Ocean Response to Hurricane Felix:
When the wind blows over the ocean, a fraction of the momentum is fluxed below the surface to force motion in the interior. That fraction, commonly referred to as the macroscopic air-to-water drag coefficient, is often represented as a function of the wind speed. At low to moderate winds, it is well established that the drag coefficient increases monotonically with the speed of the wind (Large and Pond, 1981, Fairall et al., 1996) but at very high wind speeds, the nature of the air sea interface changes dramatically, with the presence of re-suspended sea-spray and breaking waves potentially leading to a significant changes in the physics governing the dynamics. Recent estimates at hurricane force wind speeds suggest that the drag coefficient levels off, or possibly even decreases (Donelan, 2004, Powell, 2003, Black, 2006). With the exception of Jarosz (2007) these estimates have been made using atmospheric measurements, but they tend to be few and far between, in part because of the difficulty of making measurements in the harsh environment of a hurricane.
 [5]
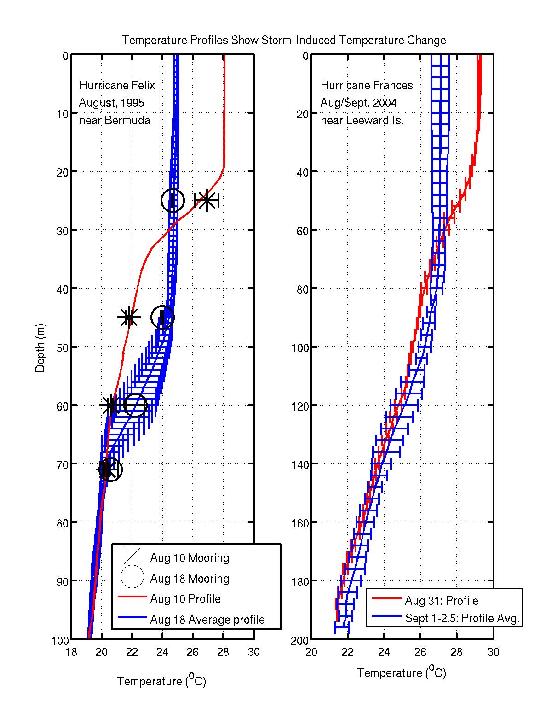
[5]Figure 1: Temperature Profiles Showing Storm Induced Temperature Changes Associated with Hurricane Felix (left) and Hurricane Francis (right) – image: S. Zedler
Figure 1 shows “Before” and “After” temperature depth profiles from vertical mixing of the water column in response to two hurricanes. On the left are profiles collected from the Bermuda Testbed Mooring (BTM) [6] and from the Bermuda Atlantic Time-Series Study (BATS) [7] in August of 1995 before and after the passage of Hurricane Felix. The data on the right was collected from a profiling float prior to and after the passage of Hurricane Frances in the Caribbean in September, 2009 (E.Terrill, Scripps Institution of Oceanography). The floats were deployed as part of the Coupled Boundary Layers/Air-Sea Transfer field program CBLAST. [8] For the Felix data, the amount of heat lost at the surface (via vertical mixing) appears to be balanced by the heat gained in the thermocline. For the Frances data, there appears to be more heat lost from the surface layer than gained in the thermocline.
Modeled Ocean response:
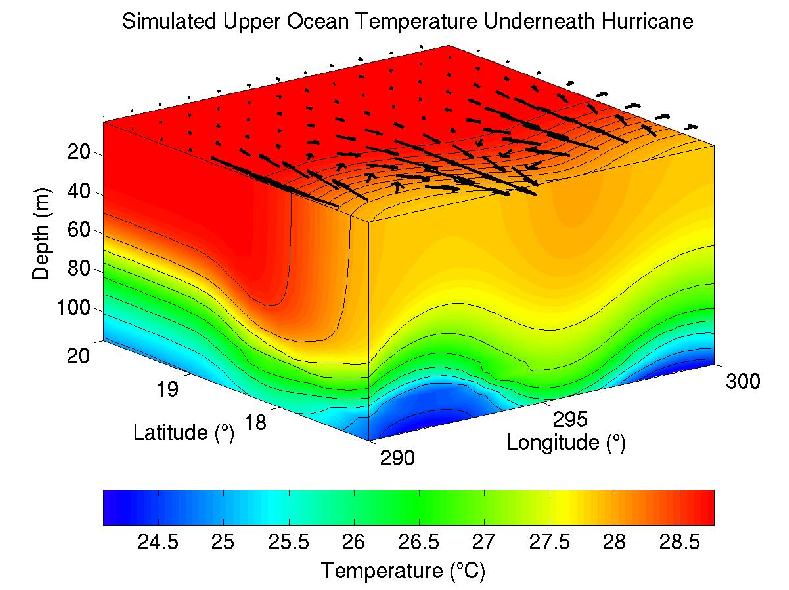
Figure 2 shows a snapshot of an ocean temperature wake simulated using MITgcm, to the east and behind a hurricane-type vortex moving at a constant speed to the west (towards lower longitude). The initial temperature field varied in the vertical, but was horizontally uniform. A vector plot of the 15-m currents is overlaid at the surface.
Beneath the cyclonic wind pattern of a hurricane, we see a divergent flow in the upper ocean to either side of the track (in this case to the north and the south), closely following the track of the storm. Deep upwelling is established underneath the storm. When the storm has passed (if the storm speed is greater than the speed of the fastest moving internal gravity wave), as is the case here, the divergent currents rotate in and out of convergence near the local inertial frequency. During passage, vertical shear in the horizontal currents builds up at the top of the seasonal thermocline, generating vertical turbulent mixing that mixes the colder water below with the warm well-mixed layer of near-surface water. Declining mixed layer temperatures can then feed back on the storm weakening it.
Cooling of the mixed layer can be seen by comparison with the temperature profile at 20oN, 290oW, as well as the rotating currents and the sinusoidal undulations of the thermocline behind the storm. Although the figure shows the temperature field at a particular time, there is a 1-1 correspondence between time and longitude (i.e. distance behind the storm) because the speed of the storm is constant, i.e., the longitude axis could easily be thought of as the time axis.
Based on the dynamics revealed in the model, the difference in profiles between the two storms shown in Fig. 1, is likely a consequence of inertial pumping of the thermocline; over an inertial period, the effect of the non-linear advection of momentum will be to cause the isotherms to be upwelled for a longer time period than they are downwelled. In which case the averaged final profile will not show much downwards vertical mixing of heat. The amount of heat lost to the atmosphere is typically around 15% (Price, 1981) of the total response, owing to the deep post-storm mixed layers and the high heat capacity of water.
About the Model:
Zedler uses a regional version of MITgcm implemented with a 1/12th degree horizontal resolution and 20 vertical layers (10 m in the upper 100m, to 500m at the bottom) in a domain 45o x 30o (43-88oW, 7-37oN) x 2000m. The hydrostatic configuration is run with a free surface on a spherical grid using KPP. The Caribbean Leeward Island chain is represented by a straight vertical wall in the south-east corner of the domain extending in the form of a straight line between (88oW, 24oN) and (58oW, 15oN). All other boundary conditions are doubly periodic, but with the domain chosen to be large enough to minimize reflection of waves at lateral boundaries over a period of 5 days as the hurricane passes through the domain. For the region not covered by land, the bottom topography is flat.
The model uses a linear equation of state and an implicit free surface with no-slip sides and bottom. The time step is 300 seconds. For more detail see Zedler et al., 2009. A low resolution hurricane model set up, Sarah set up for testing the MIT is available here [10].
Current Work & Future Directions:
Zedler continues to work on estimation of the drag coefficient by considering the inverse problem configuration whereby the Frances dataset is assimilated into MITgcm, using four dimensional variational data assimilation (Giering and Kaminski, 1998). By requiring the simulated field to match the data as closely as possible (using a maximum likelihood estimation), assuming a perfect the model is perfect, the drag coefficient can be taken as an adjustable parameter. To find out more contact Sarah [11].
Publications:
Zedler, S.E., 2009. The simulated ocean response to a hurricane. Nonlinear processes. [12] Journal of Physical Oceanography, 39(10), 2618-2634.
Zedler, S.E., P.P. Niiler, D. Stammer, E. Terrill, and J.Morzel, 2009. The ocean’s response to Hurricane Frances and its implications for drag coefficient parameterization at high wind speeds. [13] Journal of Geophysical Research – Oceans, 114, C04016, doi:10. 1029/2008JC005205.
Zedler, S.E., T.D. Dickey, S.C. Doney, J.F. Price, X. Yu, and G.L. Mellor, 2001. Analyses and simulations of the upper ocean’s response to Hurricane Felix at the Bermuda Testbed Mooring site: 13-23 August 1995. [14] Journal of Geophysical Research-Oceans, 107 (C2).
Other References:
Black, P.G., E. A. D’Asaro, W.M. Drennan, J.R. French, P.P. Niiler, T.B. Sanford, E. J. Terrill, E.J. Walsch, J. Zhang, 2007. Air-sea exchange in hurricanes: Synthesis of observations from the coupled boundary layer air-sea transfer experiment, Bulletin of the American Meteorological Society, 88(3), 357-374.
Donelan, M.A., B.K. Haus, N. Reul, W.J. Plant, M. Stiassnie, H.C. Graber, O.B. Brown, and E.S. Saltzman. On the limiting aerodynamic roughness of the ocean in very strong winds. Geophysical Research Letters, 31, L18306, 2004.
Fairall, C.W., E.F. Bradley, D.P. Rodgers, J.B. Edson, and G.S. Young, 1996: Bulk parameterization of air-sea fluxes for tropical ocean-global atmosphere coupled-ocean atmosphere response experiment, Journal of Geophysical Research, 101, 3747-3764.
Giering and Kaminski 1998 Recipes for adjoint code construction Trans. Math. Software 24 437-474 1998
Greatbatch, R.J. On the response of the ocean to a moving storm: the nonlinear dynamics:1983: Journal of Physical Oceanography, 13, 357-367.
Jarosz, E., D.A. Mitchell, D.W. Wang, and W.J. Teague, 2007: Bottum-up determination of air-sea momentum exchange under a major tropical cyclone, Science, 315, 1707-1709.
Large, W.G. and S. Pond, 1981: Open ocean flux measurements in moderate to strong winds, Journal of Physical Oceanography, 11,324-336.
Powell, M.D., P.J. Vickery and T.A. Reinhold, 2003: Reduced drag coefficients for high wind speeds in tropical cyclones, Nature, 422, 279-283.
Price, J.F., 1981: Upper-ocean response to a hurricane. Journal of Physical Oceanography, 11, 153-175.
Price, J.F. 1983: Internal wave wake of a moving storm. Part I: scales, energy budget, and observations. Journal of Physical Oceanography, 13, 949-965.


