A Cold Bloom: Modeling Productivity in West Greenland
 MITgcm helps uncover link between glacier melt and coastal productivity in Greenland.
Better Biogeochemical Modeling
 New global-ocean, data-constrained DIC budget uses the ECCO-Darwin ocean biogeochemistry state estimate.
An Ocean of Plastic
 Using their hybrid MITgcm-plastic model a Chinese-US collaboration explores the fate of the excess trash generated by COVID.
Med Modeling
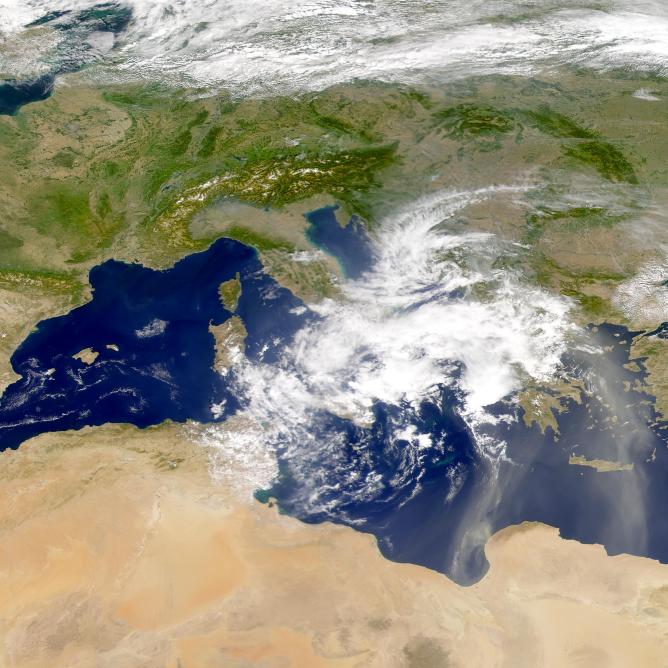 A team of Italian climate modelers has been evaluating the performance of a new version of the Regional Earth System Model (RegCM-ES) over the Mediterranean region. The model uses MITgcm for its ocean component.
Blooming Antarctica
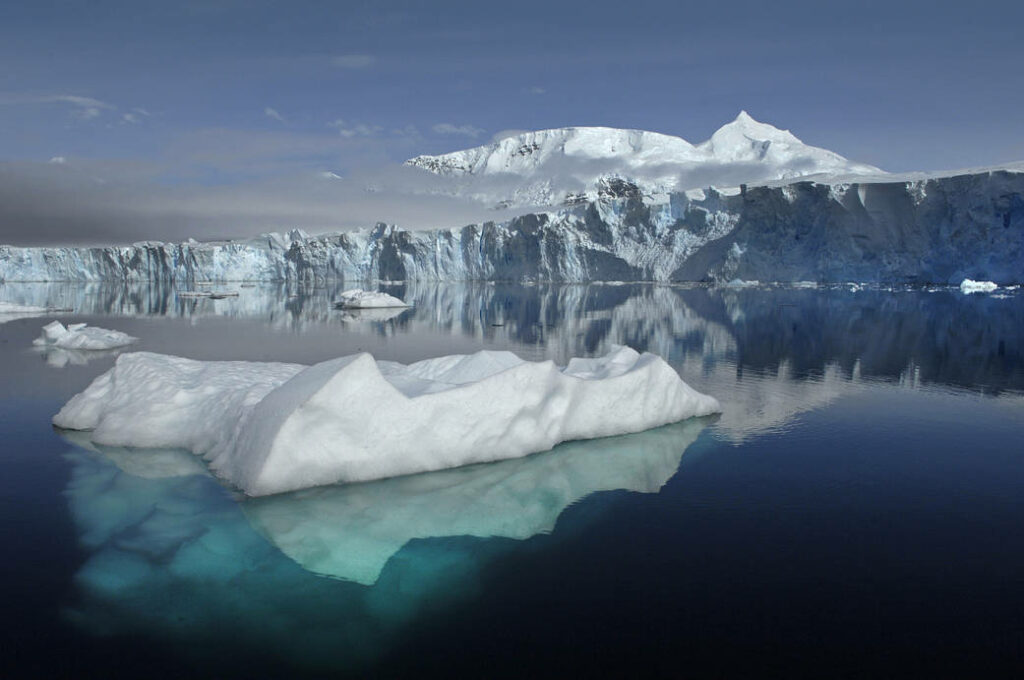 Researchers use MITgcm to understand how phytoplankton blooms and inorganic carbon respond to sea-ice variability in the West Antarctic Peninsula.
What you Can Do With a Really Rather Realistic Ocean Model
This month we spotlight research from MIT’s Darwin Project exploring how changes in spatial resolution impact emergent biogeochemistry and phytoplankton community structure in their work using MITgcm and the biogeochemical models they have built to surround it.
Shelf Life
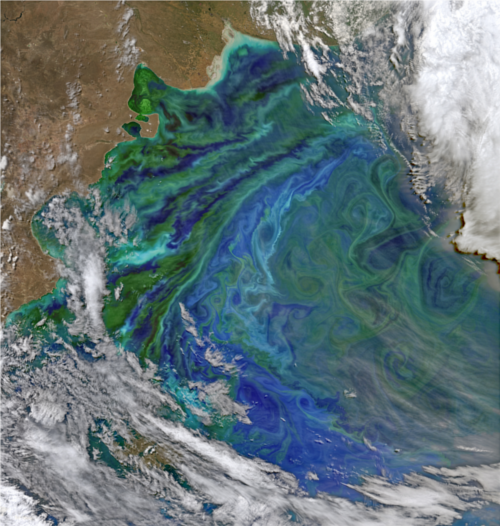 This month we focus on work led by Hajoon Song, a postdoc at MIT, who has been using MITgcm to explore nutrient sources for the Patagonia Shelf Region.
Mercury Rising
 A joint Harvard – MIT study uses MITgcm to explore the biogeochemistry of riverine mercury.
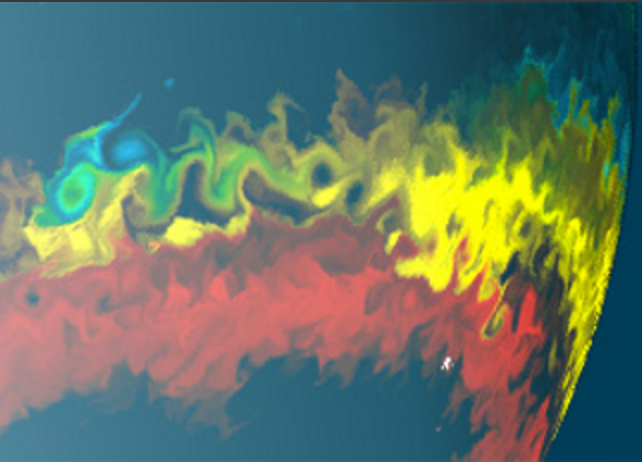
Probing Phytoplankton in the Agulhas
 This month we report on researchers using MITgcm to explore the role of Agulhas Rings in plankton transport observations from the Tara Oceans Expedition.
Arctic Carbon Cycle Modeling
 Motivated by observations indicating rapidly falling annual sea-ice minima, Manfredi Manizza and co-workers have been using an Arctic configuration of MITgcm to explore the Arctic Ocean Carbon Cycle.