Lake Modeling
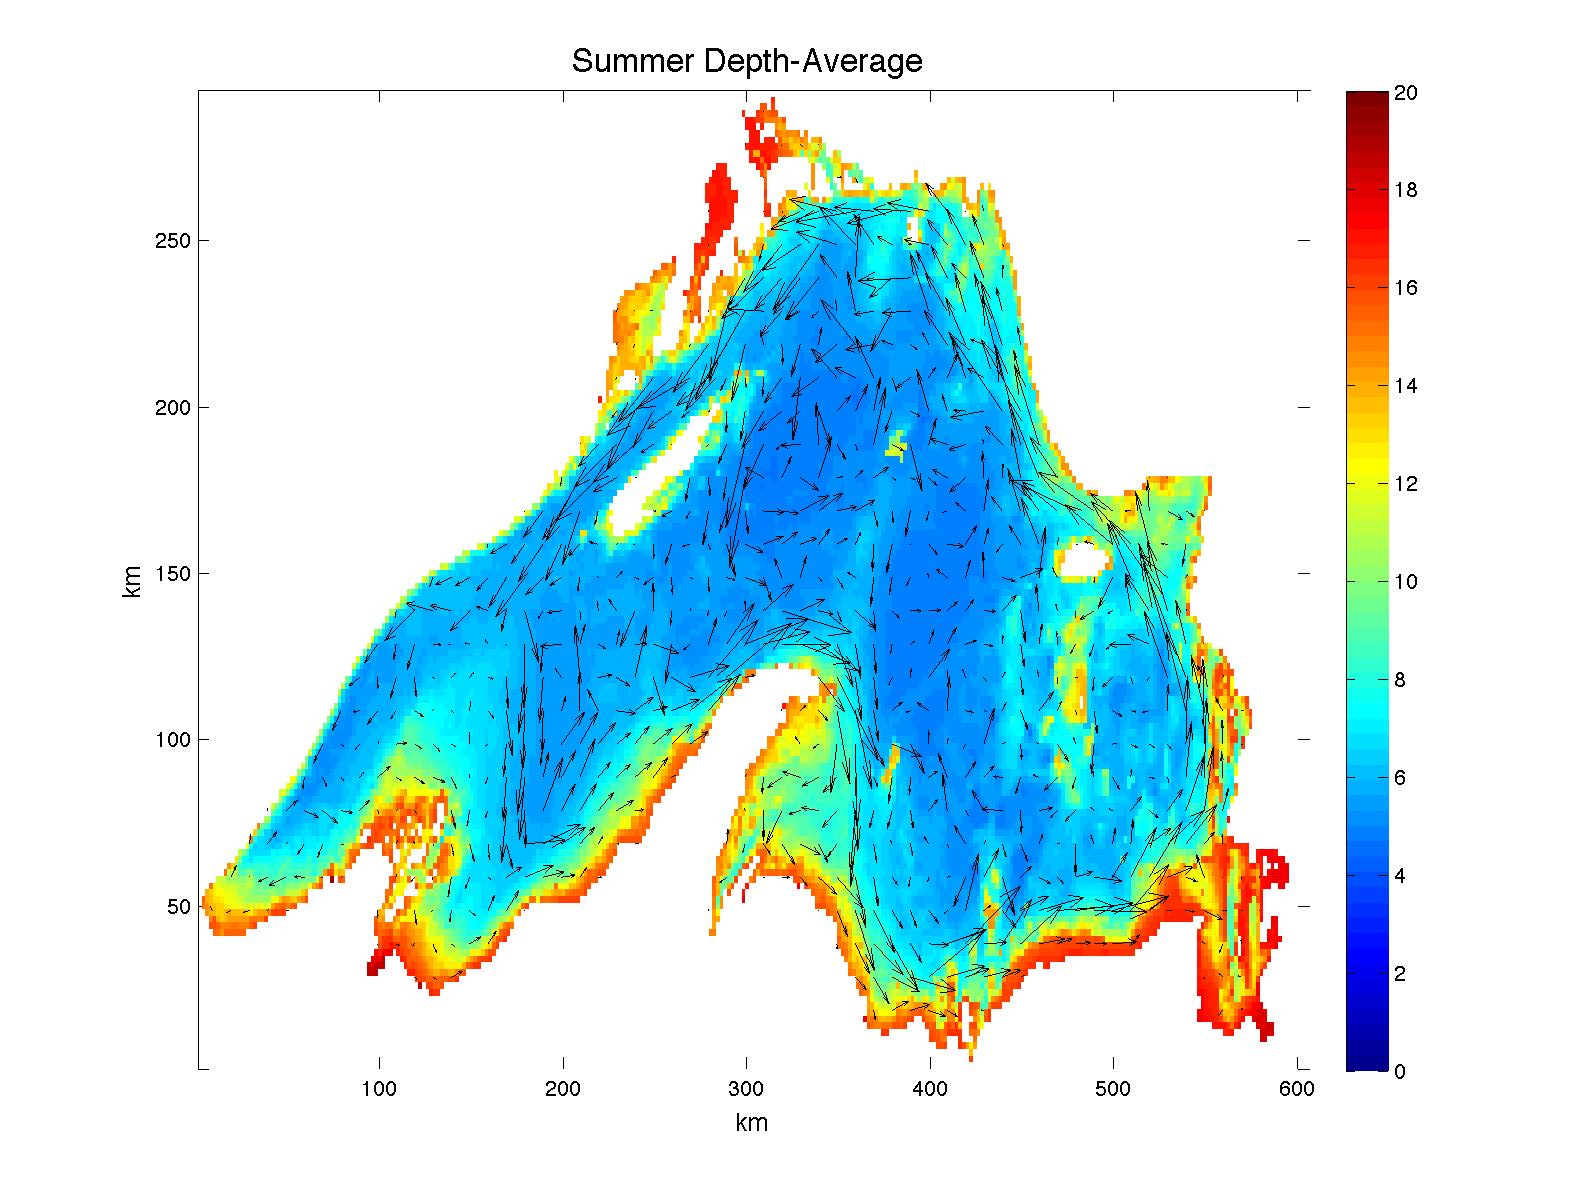
Work by Galen McKinley and Val Bennington at the University of Wisconsin, Madison using MITgcm to model the general circulation of Lake Superior as part of a project to develop a quantitative understanding of the role such bodies of water may play in the terrestrial carbon cycle…

