Arctic Carbon Cycle Modeling
story by Helen Hill 
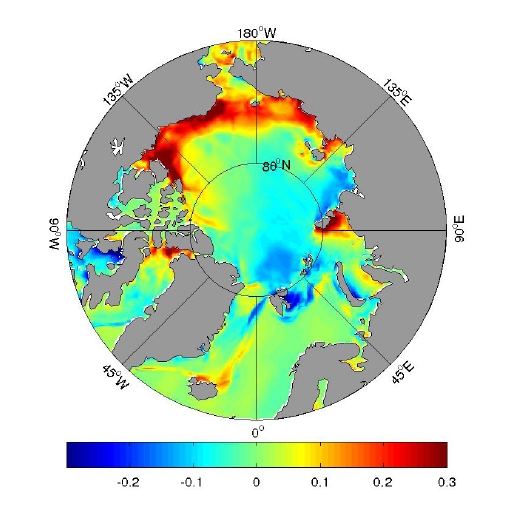
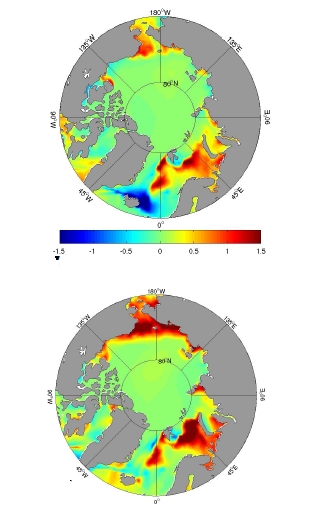
Arctic Biogeochemical Model – Change in Surface Net Community Production, year-on-year between 2006 and 2007 using MITgcm.
This month we focus on work by Manfredi Manizza (currently working as a postdoc at Scripps Institution of Oceanography, in La Jolla, CA) who together with former MIT colleagues Mick Follows, Stephanie Dutkiewicz, and Chris Hill as well as Dimitris Menemenlis (JPL) and Robert Key (Princeton) has been exploring the Arctic CO2 sink. Motivated by observations indicating rapidly falling annual sea-ice minima, the team use an Arctic configuration of MITgcm to explore the Arctic Ocean Carbon Cycle.
Motivation
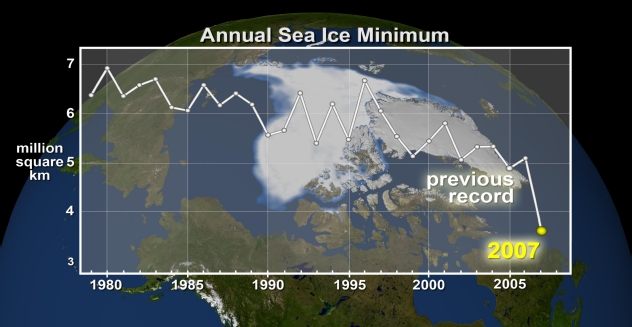
Over the past 3 decades the amount of CO2 taken up by the Arctic Ocean has almost tripled, from 24 TgC/yr to 66 TgC/yr (Bates et al., 2009). This large change is attributed to steeply falling annual sea-ice minima (fig 1a & 1b) from of order 6.5 million km2 in the early 80’s to around half that by summer 2007.
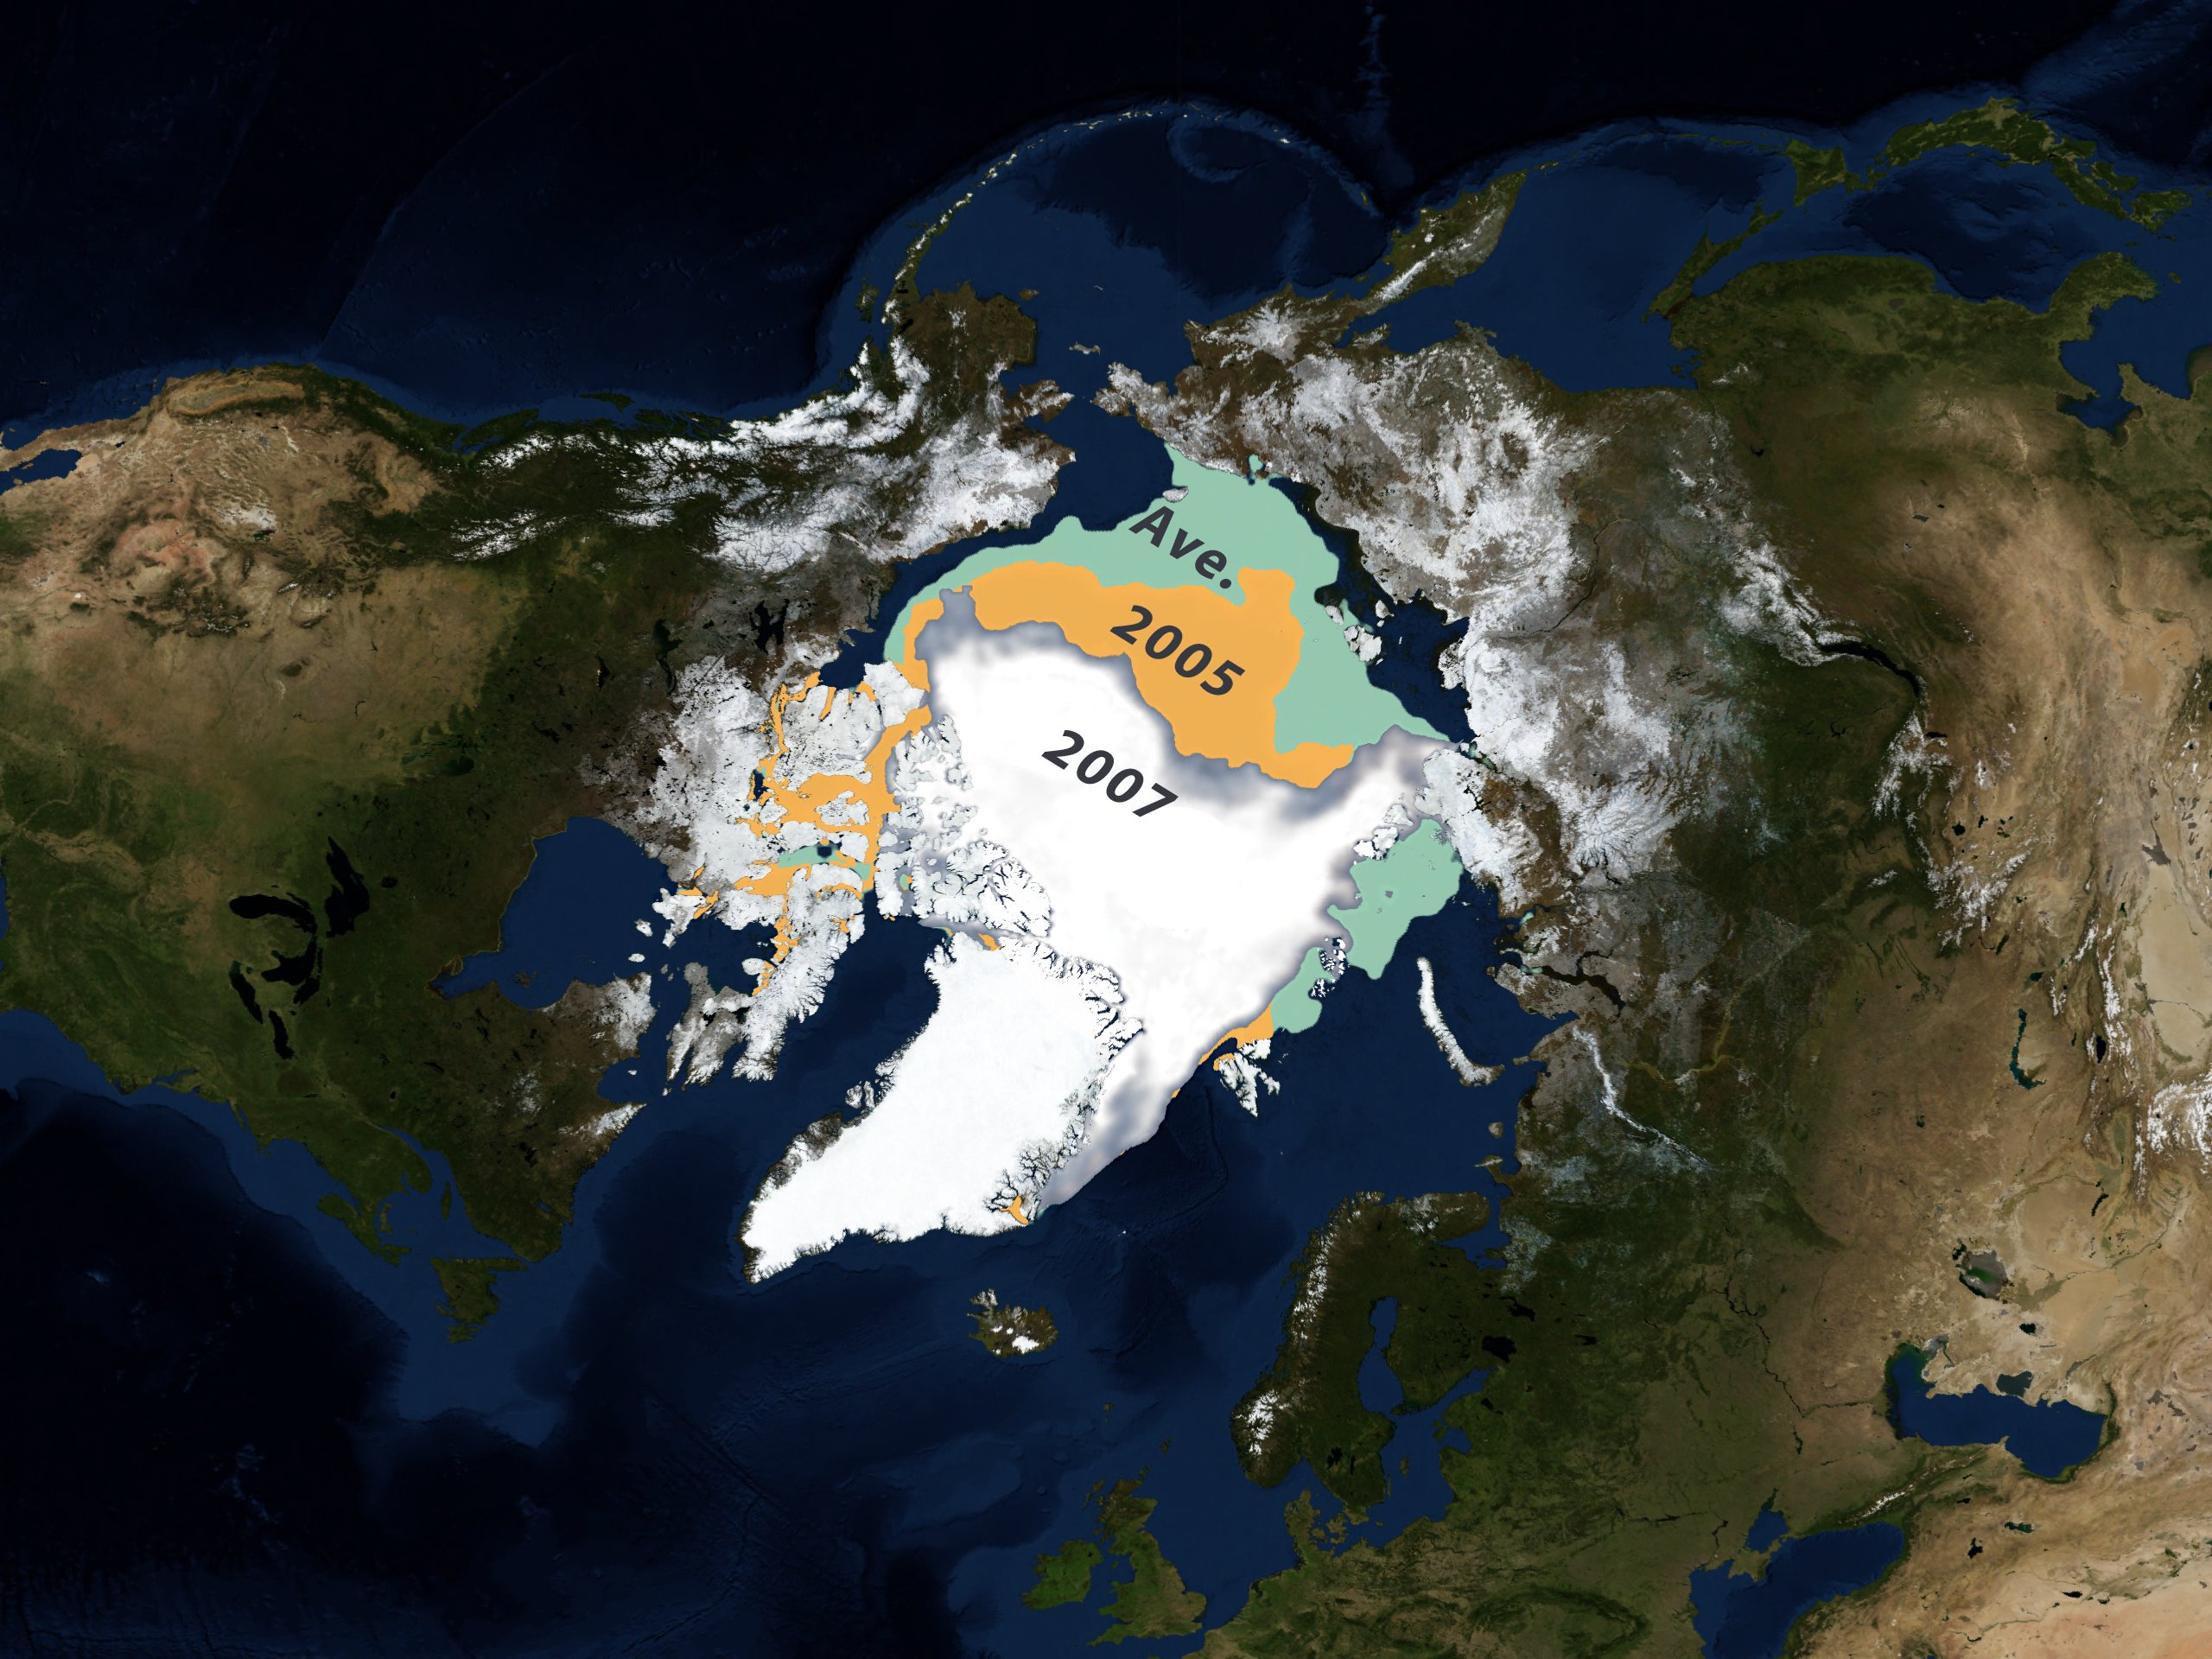
Figure 1b: Comparison of the 2007 annual Arctic minimum sea ice from 09/14/2007 with the 2005 minimum sea ice from 09/21/2005 (shown in orange). The average minimum sea ice from 1979 through 2007 is shown in green – image: NASA.
The oceans form Earth’s largest CO2 sink with the Arctic (the region beyond 65o N) contributing to an estimated ten percent of the overall pool. The presence of overlying sea-ice, tends to support under-saturation of the sea-water with respect to CO2 (fig 1c, from Bates et al., 2006).
![2006gl027028-f02_small Figure 1c: Arctic CO2 numbers: Seawater pCO2 (μatm) against sea-ice cover (%)(left) and Air-to-Sea CO2 flux (mmoles CO2 m−2 d−1)(right) [From Bates et al.,2006]](https://mitgcm.org/wp-content/uploads/2011/03/2006gl027028-f02_small.jpg)
Figure 1c: Arctic CO2 numbers: (left) Seawater pCO2 (μatm) against sea-ice cover (%) and (right) Air-to-Sea CO2 flux (mmoles CO2 m−2 d−1) – Bates et al.,2006.
Seasonality of the Arctic Ocean Carbon Cycle
Winter
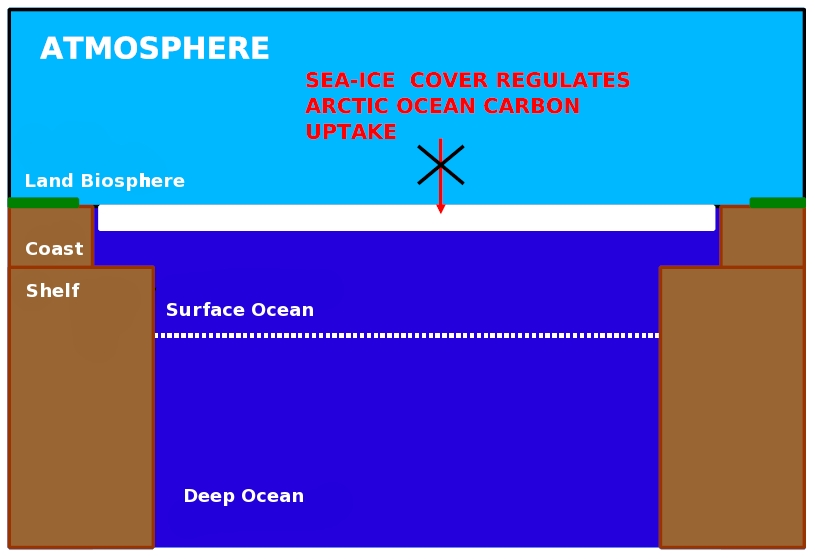
In winter, sea-ice is at its most extensive, capping the surface and preventing atmospheric CO2 from dissolving in seawater. pCO2 values are suppressed and the air-to-sea CO2 flux reduced. Values of pCO2 under sea-ice in winter increase because respiration makes DIC as a result of the low light conditions of the Arctic winter which switches off production and with it the biological draw down of CO2.
Summer
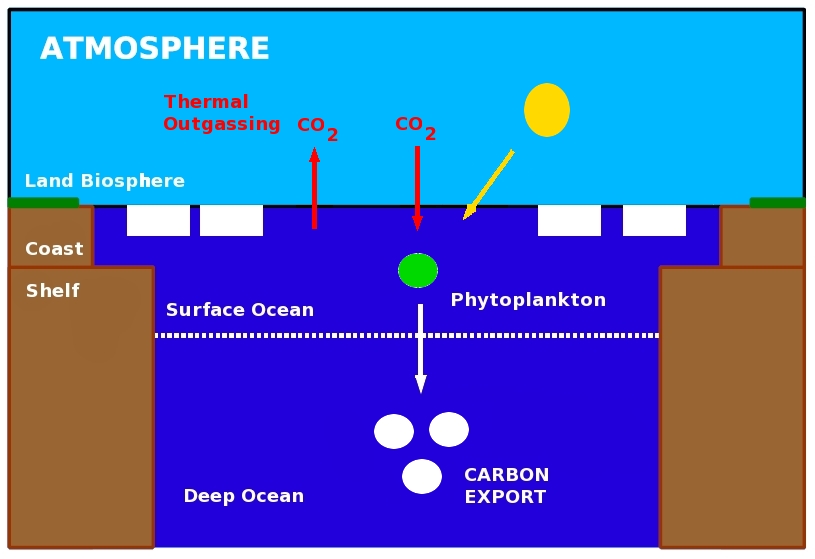
In summertime the sea-ice recedes until, around the beginning of September, a minimum is reached. Absence of ice allows free exchange of CO2 from the atmosphere to the ocean and vice versa through thermal outgassing – the so called “solubility pump”. In addition CO2 is drawn into the ocean through a competing “biological pump” in which surface dwelling phytoplankton absorb CO2 through photosynthesis. While a portion of the CO2 is released by respiration the remaining carbon is released by decomposition with net export and sequestration of carbon to the deep ocean.
The Model
Arctic Ocean Carbon-Cycle Model
- Ocean – MITgcm with ~18km Resolution, Open Boundary Conditions.
- Sea-Ice Model (Thermodynamics & Motion).
- Ocean Biogeochemical Module (5+1 tracers) (DIC, ALK, O2, DOP, PO4 + Riverine DOC) with biological production limited by light and PO4.
The OGCM is configured on a `cubed-sphere’ grid in a limited area Arctic domain with open boundaries at 55o N in the Atlantic and Pacific sectors. Manizza’s runs incorporate MITgcm’s coupled sea-ice model (details in Losch et al., 2010). Boundary conditions for potential temperature, salinity, flow and sea-surface elevation are prescribed from previous global integrations of the same model (Menemenlis et al., 2005). The grid is locally orthogonal and has a variable resolution with an average horizontal grid spacing of ~18km – allowing the model to represent eddies. Such a mesh resolves major Arctic straits, including many of the channels of the Canadian Archipelago. MITgcm has been used in the same configuration to assess the Arctic Ocean freshwater budget in Condron et al., 2009. The model was initialized with observed physical and biogeochemical fields. The atmospheric state (10m surface winds, 2m air temperature, humidity and downward long and short-wave radiation) was taken from the six-hourly NCEP reanalysis (Kalnay et al., 1996). Monthly mean estuarine fluxes of fresh water are based on the Arctic run-off database (Lammers et al., 2001). The Arctic OGCM is coupled to a simplified ocean biogeochemistry model, which explicitly represents transport and cycling of dissolved inorganic carbon (DIC), total alkalinity, phosphate, dissolved organic phosphorus and dissolved oxygen. A particular novelty here is that riverine DOC is represented explicitly: Model details are in Manizza et al., 2009 (Riverine DOC dynamics) and Manizza et al. 2011 (RDOC/OCC Coupling). The model was spun-up from 1992-1995 . Results from the study period 1996-2007 are below.
Model Results
The Changing Arctic CO2 Sink:
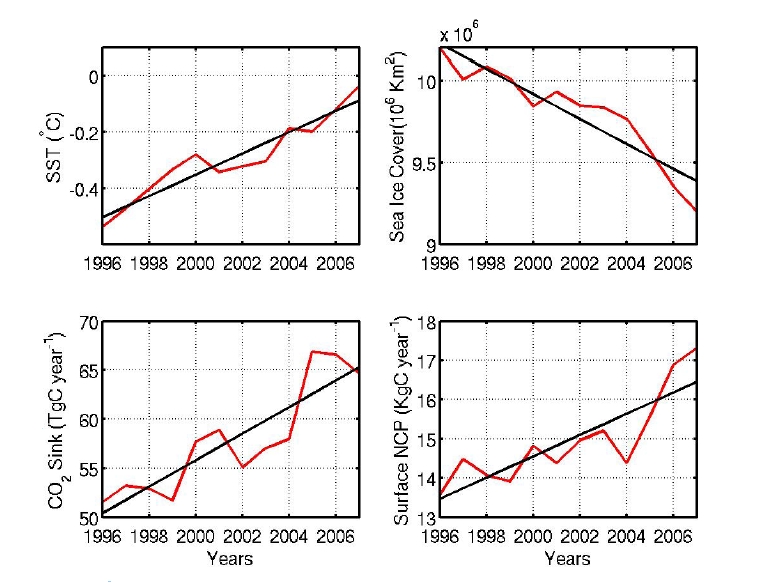
Figure 3a, above, displays time evolution results from Manizza’s model run. Top left we see annual average sea surface temperature rising from ~-0.5 oC to ~-0.1oC over the 10 year period:Top right the associated steep reduction in areal extent of sea-ice from over 10 million km2 in 1998 down to around 9.25 million km2 a decade later. Bottom left shows the amount of CO2 absorbed per year rising from ~ 50 Tg C Year-1 in 1998 to ~65 Tg C Year-1 by 2007. Finally at bottom right Manizza presents the surface Net Community Production (NCP) rising from below 1.4 Kg C year-2 to just about 1.7 Kg C year-2 by the end of the experiment. All quantities are annual averages north of 65oN.
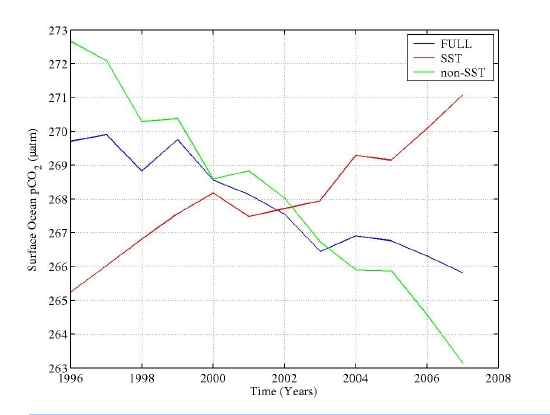
Figure 3b The blue curve indicates the temporal evolution of the annual average surface ocean pCO2 averaged over the Arctic Ocean. The red and the green curves show the temporal evolution of the effect of the solubilty and biological pump on surface ocean pCO2, respectively – source: Manizza.
Figure 3b above shows 3 graphs of surface pCO2 as a function of time. Beyond 2002 the biological pump is increasingly dominant.
Changes in the Solubility Pump Anomaly |
Changes in Sea Ice Cover Anomaly |
Change in CO2 Flux Anomaly |
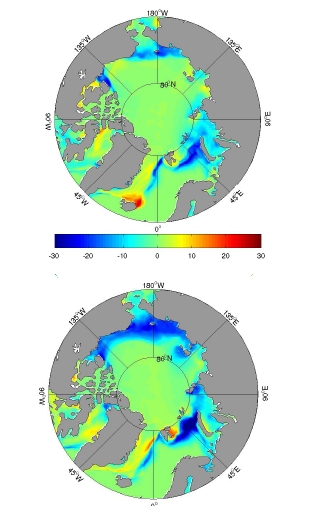
Figure 4 compares SST, sea ice coverage and CO2 flux anomalies from the 1996-2007 average showing the regional variation in each for the modelled domain. Figure 4a maps the SST anomaly for 2005 (top) and 2007 (bottom). Figure 4b maps the sea ice cover anomaly for 2005 (top) and 2007 (bottom). Finally, figure 4c maps the corresponding delta CO2 anoamly for 2005 (top) and 2007 (bottom). The strongest and most geographically extended signal is centred around 180oW. Surface waters are approaching 1.5 degrees warmer, exhibit up to 30 percent less ice and produce up to ~0.1 gC m-2 year-1 of CO2 in the 2007 model run when compared with 2005 values.
Model-Data Comparison
Model
Figure 5 shows the changes in production and air-sea CO2 flux between 2007 and 2006 from MITgcm (the biogeochemical model). Ranging up to ~0.3 gCm-3year-1, there is a clear signal of increased NCP in the western Arctic, north of the Bering Sea (figure 5a) with corresponding net intake of CO2 in the same region over the same period (figure 5b).
Satellite Observations
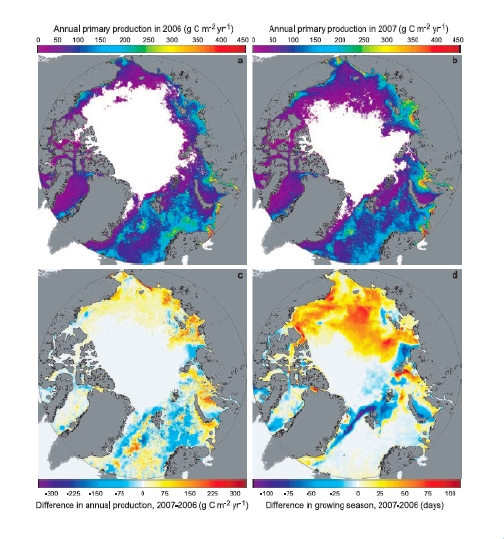
Figure 6, from Arrigo et al., 2008, compares primary productivity in (a) 2006 and (b) 2007 with the difference in primary productivity between the 2 years (in gC m-2 year-1) shown in (c). A second measure, the year-on-year difference in growing season between 2006 and 2007 is shown in (d). For the region significantly increased productivity (around 180 oW), the growing season is increased by over 3 months in some locations.
Conclusions:
Besides helping quantify the annual estimates for the CO2 sink in the Arctic Ocean (58 TgC year-1), these model-based results highlight its variability, as well as verifying previous data-based estimates (20-100 TgC year-1). In particular these results suggest that events of drastic sea-ice reduction can lead to a significant increase in CO2 uptake in the Western Arctic Ocean. Overall this study suggests that, although its efficiency would be lowered by a weaker solubility pump, future Arctic warming and associated sea-ice reduction is likely to produce a negative carbon-climate feedback in the Arctic region.
To find out more about this work, contact Manfredi.
Publications
Arrigo K.R., van Dijken, G. and Pabi (2008) Impact of a shrinking Arctic ice cover on marine primary production. Geophysical Research Letters 35, doi:10.1029/2008GL035028
Bates, N. R., S. B. Moran, D. A. Hansell, and J. T. Mathis (2006), An increasing CO2 sink in the Arctic Ocean due to sea-ice loss, Geophys. Res. Lett., 33, L23609, doi:10.1029/2006GL027028.1.
Bates, N.R. and J.T. Mathis (2009), The Arctic Ocean marine carbon cycle: evaluation of air-sea CO2 exchanges, ocean acidification impacts and potential feedbacks, Biogeosciences, 6, 2433–2459
Condron et al. (2009), Simulated Response of the Arctic Freshwater Budget to Extreme NAO Wind Forcing, J. Climate, 22, 2422–2437, doi: 10.1175/2008JCLI2626.1
Kalnay, E., et al. (1996), The NCEP/NCAR 40-year reanalysis project, Bull. Am. Meteorol. Soc., 77, 437–471, doi:10.1029/2004GB002342
Lammers, R B., A.I. Shiklomanov, C.J. Vo ̈ro ̈smarty, B.M. Fekete, and B. J. Peterson (2001), Assessment of Contemporary Arctic River RunOff based on observational discharge records, J. Geophys. Res., 106(D4), 3321 – 3334, doi:10.1029/2004GB002342
Losch M., D. Menemenlis, J-M. Campin, P. Heimbach, and C.N. Hill (2010) On the formulation of sea-ice models. Part 1: Effects of different solver implementations and parameterizations Ocean Modelling, 33, 129-144, doi:10.1016/j.ocemod.2009.12.008
McGuire, A.D., D.J. Hayes, D.W. Kicklighter, M. Manizza, Q. Zhuang, M. Chen, M.J. Follows, K.R. Gurney, J.W. McClelland, J.M. Melillo, B.J. Peterson and R.G. Prinn (2010), An analysis of the carbon balance of the Arctic Basin from 1997 to 2006 Tellus, doi:10.1111/j.1600-0889.2010.00497.x
Manizza, M., M. J. Follows, S. Dutkiewicz, J.W. McClelland, D. Menemenlis, C.N. Hill, A. Townsend-Small, B. J. Peterson (2009) Modeling transport and fate of riverine dissolved organic carbon in the Arctic Ocean Global Biogeochemical Cycles, 23, GB4006, doi:10.1029/2008GB003396
M. Manizza, M.J. Follows, S. Dutkiewicz, D. Menemenlis, J.W. McClelland, C.N. Hill, B.J. Peterson, R. Key (2011) A Model of the Arctic Ocean Carbon Cycle Submitted to Journal of Geophysical Research – Oceans.
M. Manizza, M.J. Follows, S. Dutkiewicz, D. Menemenlis, C.N. Hill, R. Key (2011) Modeling the recent changes of the CO2 sink in the Arctic Ocean (1996-2007) : A regional analysis. To be submitted to Global Biogeochemical Cycles
Menemenlis, D. et al. (2005) NASA Supercomputer Improves Prospects for Ocean Climate Research EOS, Tansactions of the American Geophysical Union, 86, 9, p.89, doi:10.1029/2005EO090002

