Tidal Mixing Over Rough Topography
story by Helen HillThis month we focus on the work of recent doctoral graduate Maxim Nikurashin (now working at GFDL) who, in a collaboration with long time user Sonya Legg, has been using a non-hydrostatic, 2-D version of the MITgcm to explore tidal mixing over rough topography (Fig. 1). The MITgcm’s elegant non-hydrostatic and topography-representing capabilities make it an ideal choice for this kind of high-resolution process study.
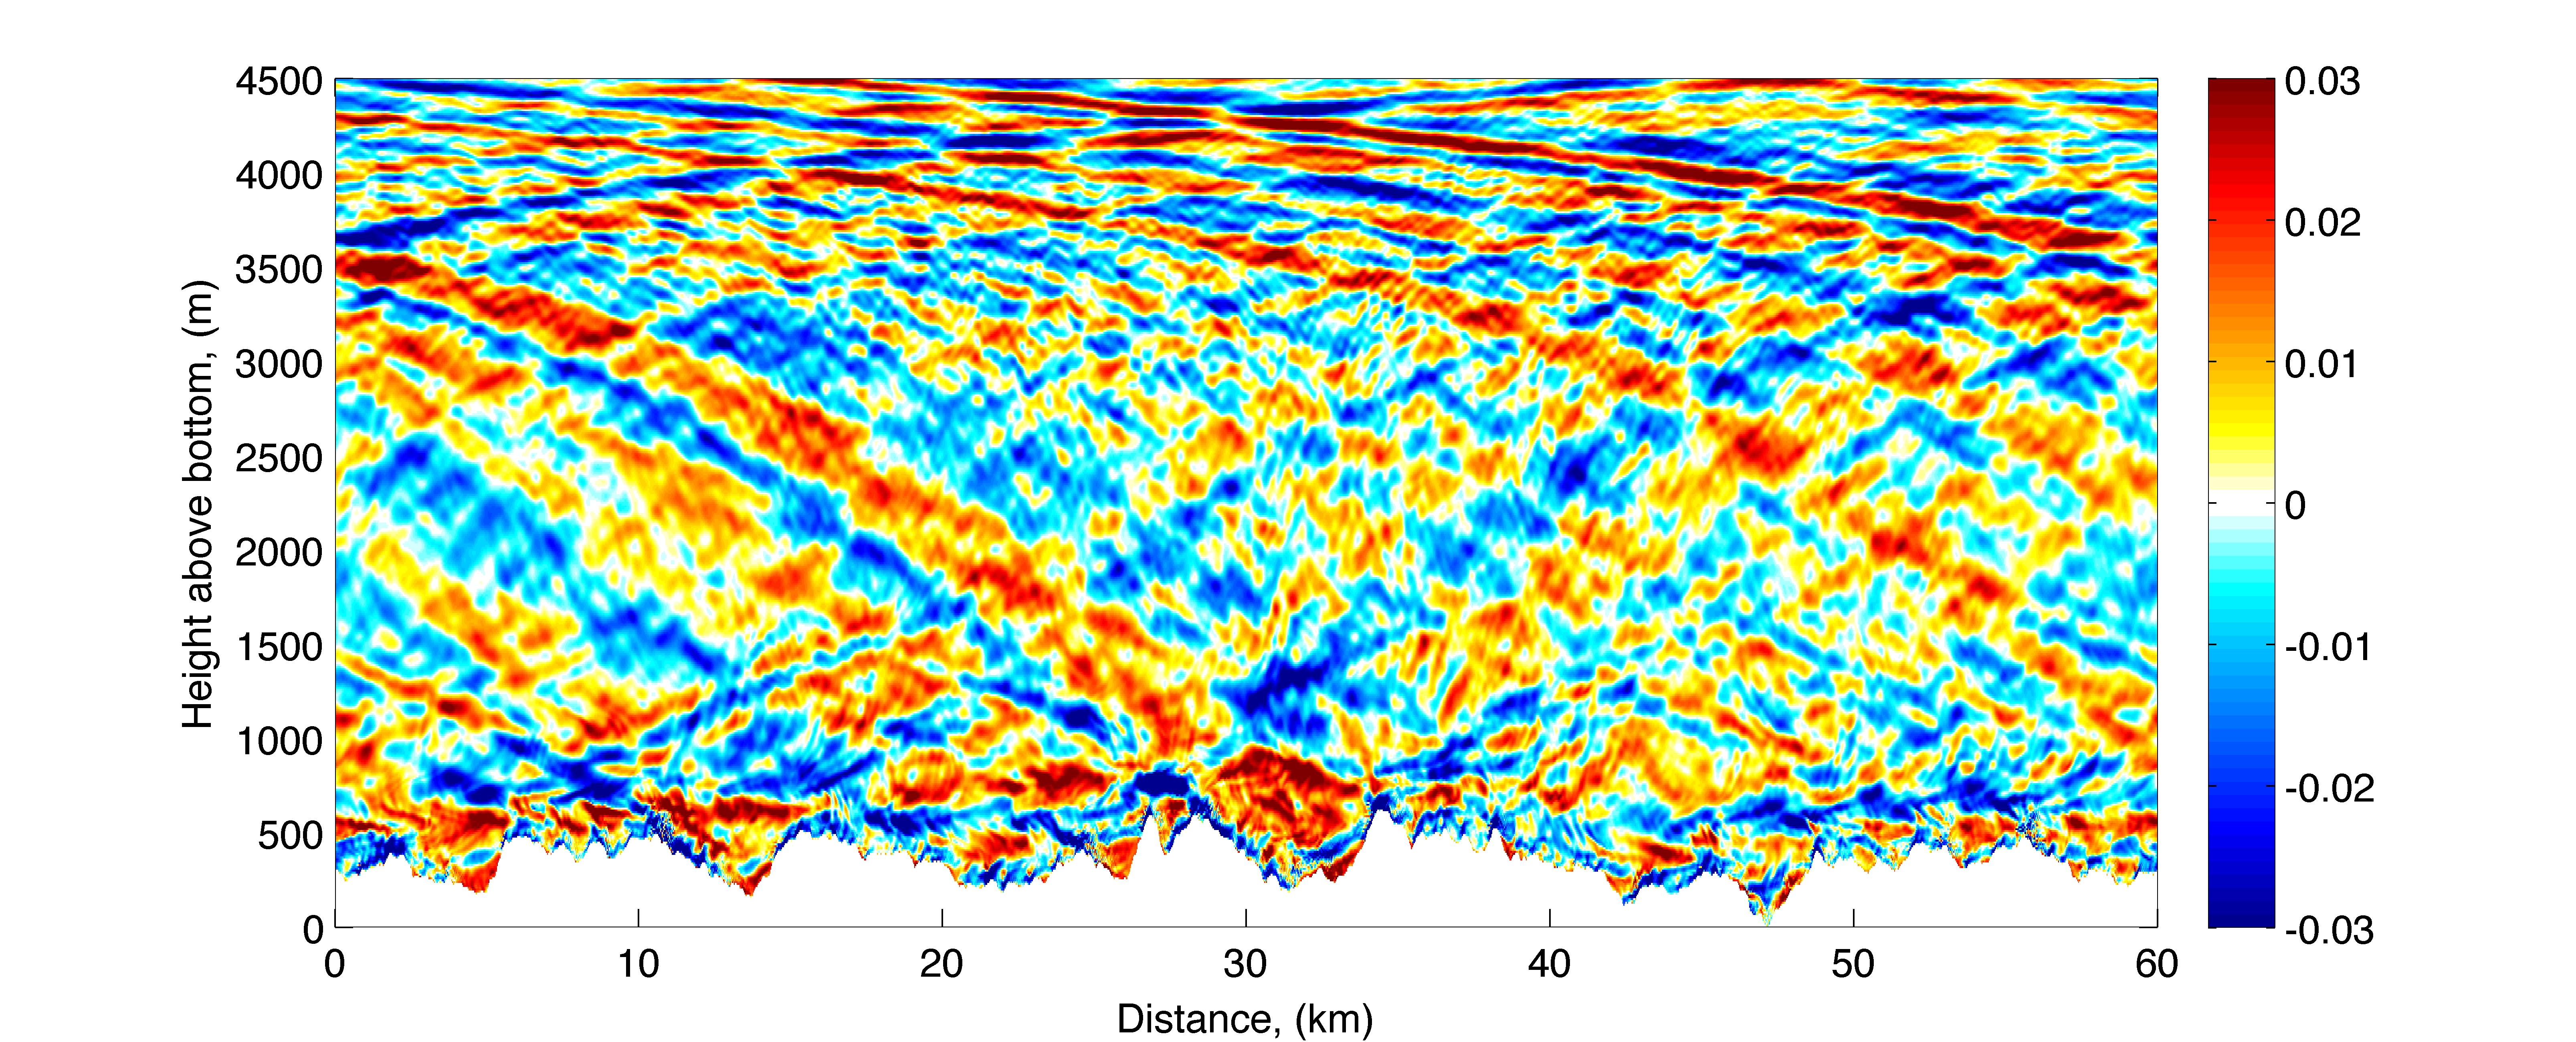
Figure 1: Snapshot of wave zonal velocity (ms-1) deviation from the barotropic tide from the control simulation in Nikurashin and Legg’s high-resolution 2-D, MITgcm study of tidal mixing over rough topography.
Taking the Mid-Atlantic Ridge (MAR) region of the Brasil Basin (Fig. 2) as the prototype for their idealised problem, Nikurashin and Legg constructed synthetic bottom boundary conditions having the same spectral characteristics as the abyssal hills observed to cluster along the long, deep canyons of the MAR. It is believed (Polzin et al., 1997) that the enhanced mixing observed within O(1km) of the bottom at this location (Fig. 3) is the result of radiation and dissipation of breaking internal waves generated by tidal flow over the especially rough local topography.
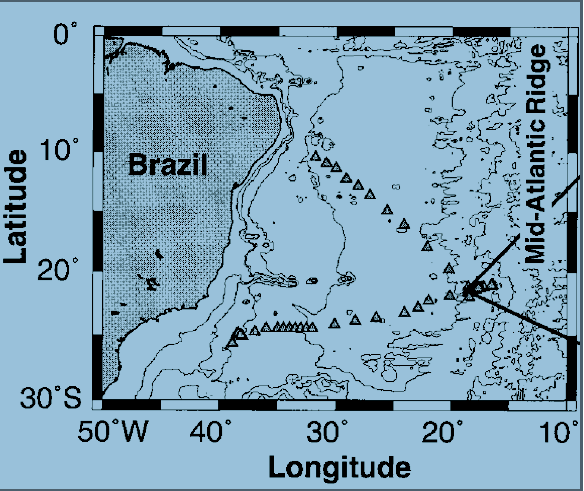
Figure 2: Map of the Brasil Basin in the South Atlantic Ocean (Polzin et al., 1997). Arrow indicates location of Mid-Atlantic Ridge (MAR) section in fig. 3.
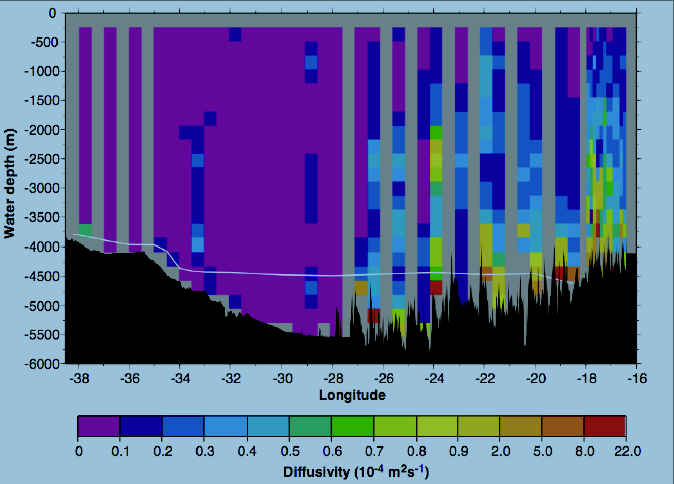
Figure 3: Vertical section of diapycnal diffusivity (m2/s) in the Brazil Basin (from Polzin et al., 1997). Mixing, believed to be sustained by upward radiating waves, is observed to be enhanced in the bottom O(1km) over the rough topography of the MAR.
With the ultimate goal of developing physically-based parameterizations for general circulation model use, Nikurashin and Legg set about reproducing the essence of the MAR tidal mixing scenario in multiple 2D realisations of the flow associated with the barotropic M2 tide, U(t), as it interacts with MAR-like synthetic bottom topography (U(t) = Uocos(ωt), in their control u0 = 2.5cm/s, ω=1.4e-4s-1). To understand the impact of depth-varying stratification on their solutions, Nikurashin and Legg constructed two stratification scenarios one depth-independent, the other an idealisation of the observed profile. Working at very high resolution (Δx = 10 – 30 m, Δz = 5 – 10 m, viscosity = 10-3 m2s-1, diffusivity = 10-5 m2s-1), the domain was periodic and bounded by a surface sponge layer.
Figure 1, a snapshot of the wave zonal velocity deviation from the barotropic tide for their control simulation, clearly demonstrates the upward radiation and dissipation of the internal tides generated in N&L’s realizations.
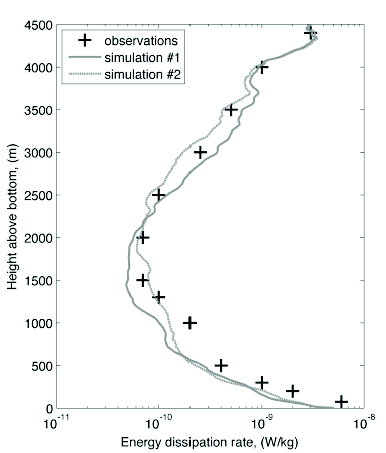
Figure 4: Energy dissipation (W/kg) from observations (crosses) and from two simulations with different realizations of synthetic topography.
As in Polzin et al’s 1997 observations, mixing is enhanced in the bottom O(1km), rising again through the thermocline (Figure 4) with the total depth-integrated energy dissipation of 3.2mWm-2 falling close to Polzin et al.’s value of 3.7mWm-2. Further analysis demonstrated both bottom energy conversion and energy dissipation departed markedly from linear theory: Predictions based on Bell (1975) over-estimating energy conversion for steep topography (Figure 5) and energy dissipation decaying much faster from the bottom than the vertical structure used in Simmons et al., 2004, recently proposed, energetically consistent mixing parameterization, relating diapycnal diffusivity to energy dissipation due to internal tides (Figure 6).
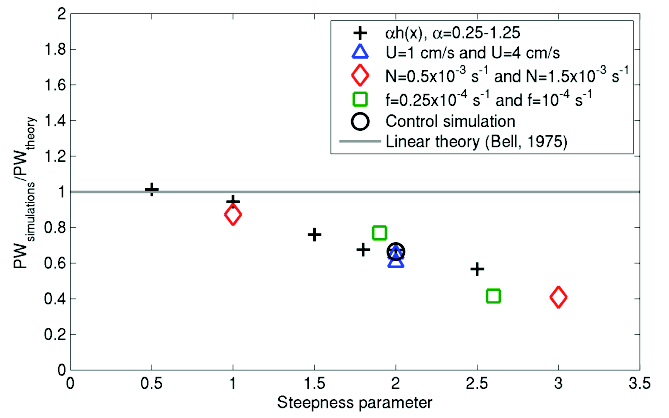
Figure 5: Bottom energy conservation normalised by linear prediction from Bell (1975), plotted as a function of a steepness parameter defined as the ratio of the characteristic topographic slope to the wave slope for a range of different parameters.
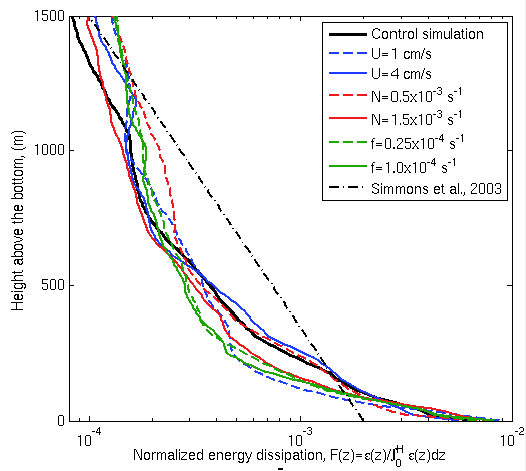
Figure 6: Profiles of energy dissipation from simulations with different values of tidal amplitude, stratification and rotation rate, normalized by depth-integrated values; (dashed black) vertical structure function of energy dissipation used in Simmons et al., 2004 parameterization.
Want to find out more? – contact Max.
References:
Polzin, K. 1997: Spatial Variability of turbulent mixing in the abyssal ocean. Science, 276, 93-96.
Simmons, H.L., S.R. Jayne, L.C. St.Laurent, and A.J. Weaver, 2004: Tidally driven mixing in a numerical model of the ocean general circulation. Ocean Modelling,6 , 245-263.


