Figure 1: A snapshot of relative vorticity (in colors) and pressure (relief) at 100 m depth in a simulation with realistic, though idealized, forcing from an MITgcm simulation by Wolfe and Cessi . The color range spans =B15e-4 s^{-1}. The domain is a simple “notched box” ocean with vertical walls and periodic channel in the southernmost 1200 km.
Here we look at work of Christopher Wolfe and Paola Cessi at UCSD, in which they investigate the equilibrium response of an eddy-resolving version of MITgcm to variations in the external parameters of diffusivity, wind forcing and geometry, with particular attention to the meridional overturning circulation (MOC) and deep stratification.
At its simplest, the ocean can be thought of as consisting of three water masses: bottom water of southern origin, deep water of northern origin, and waters of the main thermocline (Fig 2).

Figure 2: Schematic of the abyssal overturning cells and deep stratification in an eddy-free model (after Vallis 2000)
Diffusive interfaces (thermoclines) separate these water masses and upwelling through these supports a set of overturning cells: the deep and mid-depth cells associated with the bottom and deep water masses, respectively. In addition to upwelling diffusively, an unknown fraction of deep water may upwell adiabatically due to Ekman suction in the southern channel (Toggweiler and Samuels, 1995).
The Basic Model
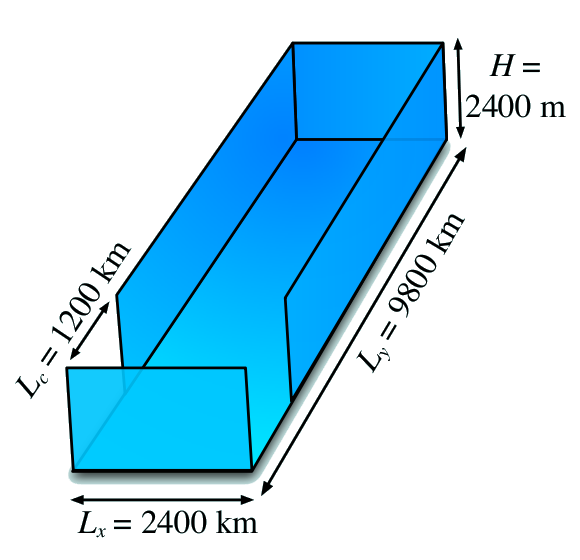
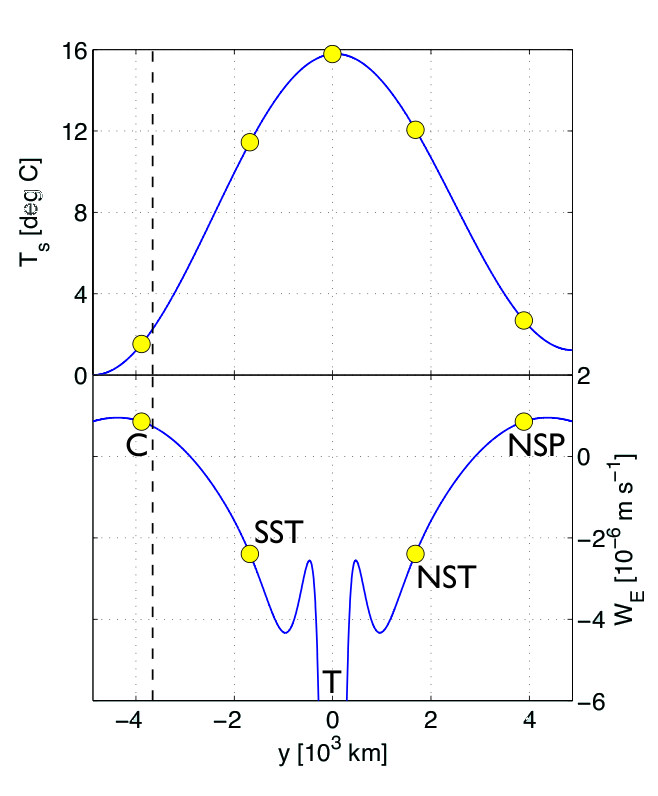
Employing a hydrostatic version of the MITgcm, Wolfe and Cessi’s implementation has an eddy-resolving horizontal resolution of 5.4km. The vertical grid-scale varies over 20 levels from 0(10m) at the surface to 0(200m) at depth. The model uses isotropic Laplacian diffusion with a value of κ = 0.49 x 10⁻⁴ m2s-1 for the base-line case. The domain corresponds to a flat-bottomed, notched box on an equatorial β-plane (fig 3a). The model is forced by symmetric winds with the surface temperature relaxed to a prescribed temperature profile (fig3b). Buoyancy is a linear function of temperature. [run parameters].
Effect of Diffusivity
As diffusivity decreases:
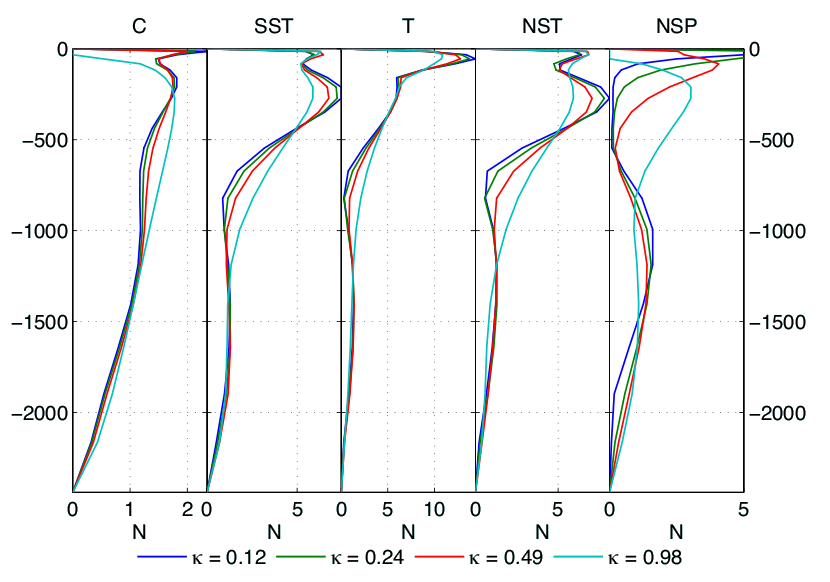
- An abyssal thermostad and thermocline appear (Fig4a).
- The abyssal thermostad is insensitive to diffusivity for small κ (Fig 4a).
- The internal thermocline sharpens (Fig 4a).
- The pool of northern deep water thickens (Fig 4b).
- The mid-depth cell decreases in strength but increases in horizontal and vertical extent (Fig 4b).
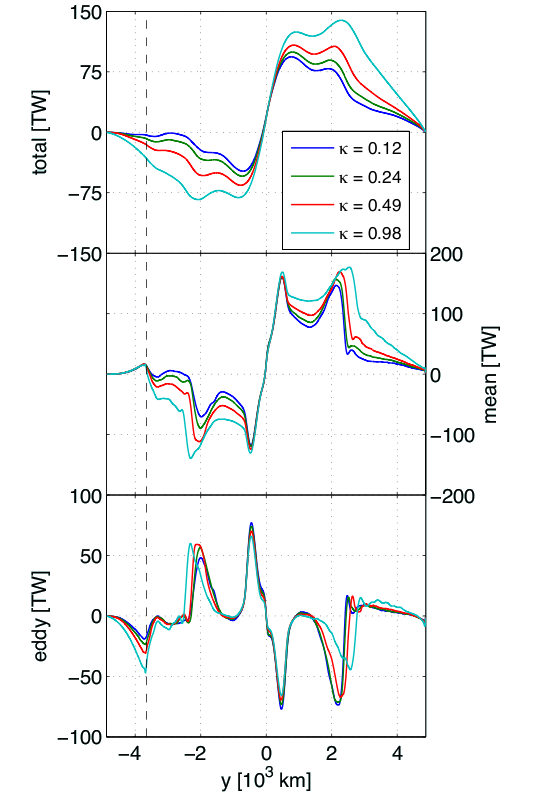
- The total heat flux decreases, especially in the channel region (Fig 4c).
- The mean heat flux within the channel is fixed (Fig 4c).
- The Eddy heat flux outside the channel is fixed (for small κ) (Fig 4c).
- The circulation appears to be tending to a zero residual state where non-zero mean and eddy flux sum to zero (Fig 4c).
Effect of Wind Forcing
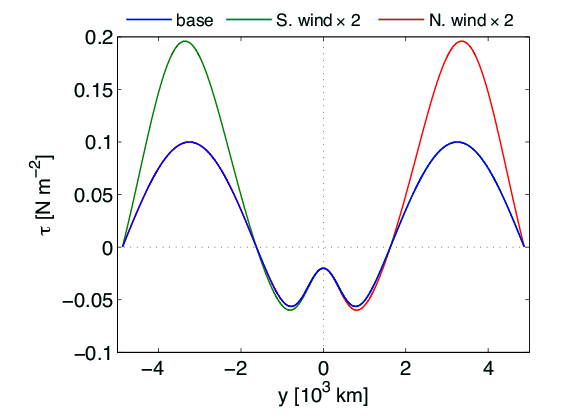
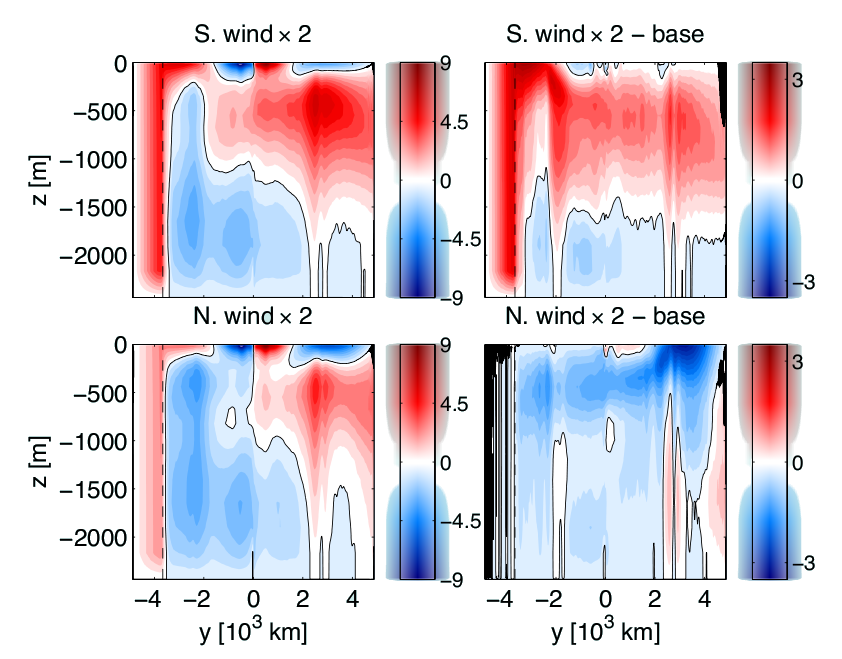
Doubling the southern winds (Fig 5a):
- The Deacon cell increases in proportion to the wind but the eddy fluxes cancel this increase such that the channel heat flux remains unchanged (Fig 5c).
- The mid-depth cell becomes stronger (~1 Sv), possibly due to increased channel suction (Fig 5b).
- There is increased northward heat flux consistent with increased MOC strength. (Fig. 5b)
Doubling the northern winds (Fig 5a):
- The mid-depth cell decreases in strength (~2 Sv) (Fig 5b).
- There is decreased northward heat flux consistent with decreased MOC strength with an increased flux in region NSP due to spin up of the subpolar gyre (Fig 5c).
Effect of Geometry
Blocking the channel:
- Floods the abyss with bottom water; all isotherms move upwards with little abyssal stratification of thermocline.
- The deep cell strengthens but the mid-depth cell shuts down.
Blocking the equator (south only):
- The deep water thermostad disappears.
- The deep cell moves downward but with little change in strength.
- There is a small effect on heat flux.
Blocking the equator (north only):
- The abyss fills with deep water.
- The mid-depth cell expands vertically but with little change in strength.
- Again, there is only a small effect on heat flux.
In summary Wolfe and Cessi find that their study supports a number of the conclusions of the eddy-free theory (eg Vallis 2000); namely that for realistic deep stratification and overturning there must me: a zonally re-entrant channel, a source of dense abyssal water south of the northern edge of the channel and a source of less-dense abyssal water in the hemisphere opposite the channel. They also find that relatively large increases in the magnitude of the wind forcing cause modest increases in the MOC in the opposing hemisphere, but do not alter the qualitative picture. They find some support for the κ-1/2 scaling for large κ. Want to know more? Contact Christopher W….
A beautiful movie
In the movie below we see vorticity at 100 m depth for a high-resolution ocean model in a two-hemisphere basin with a zonally reentrant channel spanning the southernmost eighth of the domain. References: Toggweiler, J. R., and B. Samuels, 1995: Effect of Drake Passage on the global thermohalinel circulation, Deep-Sea Res., 42, 477-500. Vallis, G. K., 2000: Large-scale circulation and production of stratification: effects of wind, geometry and diffusion, J. Phys. Oceanogr., 30, 933-954.

