The Role of Ocean Circulation in Atlantic Decadal Variability
story by Helen Hill
This month we look at work by Martha Buckley, David Ferreira, Jean-Michel Campin, Ross Tulloch and John Marshall, who have been using MITgcm to explore what role ocean circulation may play in Atlantic decadal variability. On inter-annual time scales, SST (sea surface temperature) variability is forced by air-sea heat flux variability resulting from atmospheric variability (eg the SST tripole associated with NAO, the North Atlantic Oscillation). On longer, decadal timescales, however, SST variability is far less well understood although there is evidence that the ocean circulation plays a role. Asking the question: What is the role of the ocean circulation in Atlantic decadal SST variability, Buckley and co-workers use MITgcm to analyse the behavior of thermal anomalies within the framework of an idealised GCM.

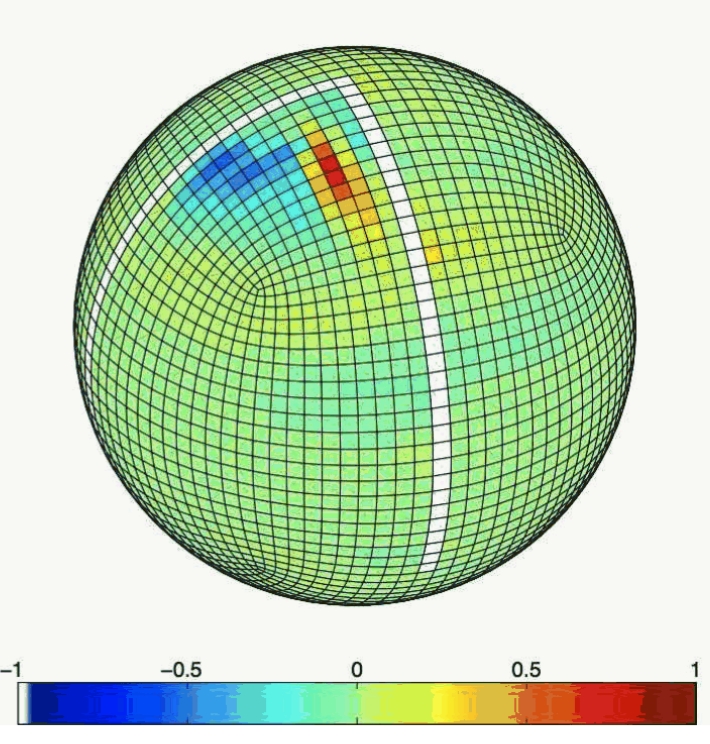
Figure 1: First EOF of the northern hemisphere, small basin SST variability (19.5% variance) – image credit M. Buckley
The Model
- MITgcm “Double Drake” configuration (All water except 2 ridges extending from the North Pole to 34oS)
- 5 level atmosphere, primitive equations (SPEEDY)
- a 15 level, flat bottomed ocean of depth 3km
- an atmosphere-and-ocean model on a cubed sphere grid at 3.7o resolution in latitude
- Gent-McWilliams eddy parameterization (the diffusivity of GM 1200m2s-1. The vertical diffusivity is 3 x 10⁵m2s-1)
- Convective adjustment through enhanced vertical mixing of temperature and salt
- Thermodynamic ice model (Winton, 2000)
The team prescribe present day orbital forcing and CO2 levels. The seasonal cycle is represented, but there is no diurnal cycle. Fluxes of momentum, heat, and freshwater are exchanged every hour (the ocean model time step). The model is spun-up from a state of rest with temperature and salinity distributions taken from a zonal-average ocean climatology.
Mean State

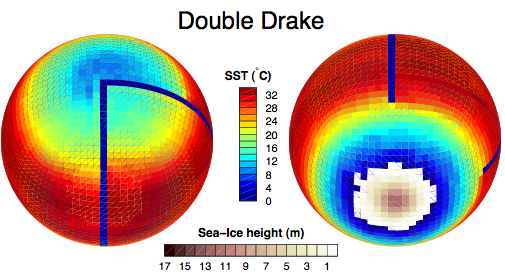
Figure 2: With the northern pole in view to the left, the southern pole to the right, sea surface temperature, and sea-ice height from a Double Drake experiment – image credit D. Ferreira
The mean state of the ocean after spin-up, while a simplification, shares a number of key Earth-like characteristics (Ferreira et al, 2010):
- Inter hemispheric asymmetry: The North Pole is warmer than the South Pole which has an ice cap.
- The larger basin is fresh relative to the smaller basin exhibiting a primarily wind driven circulation.
- The smaller basin is saltier and exhibits a convectively driven deep meridional overturning circulation (MOC).
- Heat transport in larger basin, controlled by Ekman transport and gyre dynamics, is poleward in both hemispheres.
- Heat transport in smaller basin is northward in both hemispheres due to the contribution of the MOC.
SST Variability on Decadal Timescales
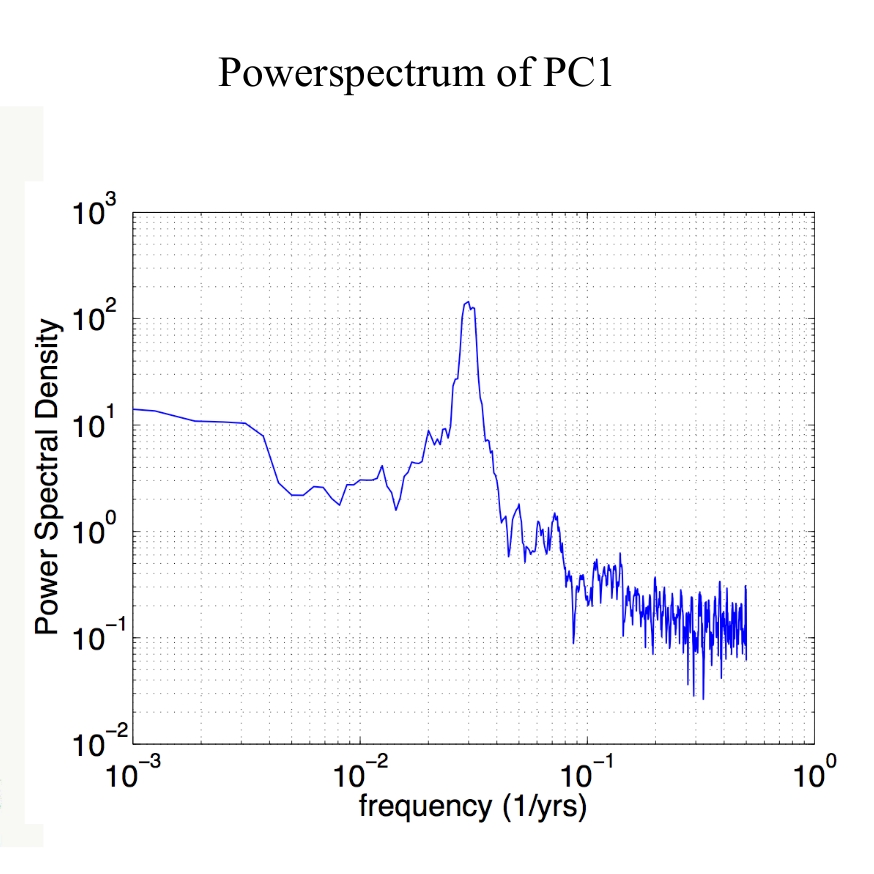
Working with annual average data from an 800 year run (after equilibrium had been reached), figure 1 shows the first EOF of temperature at a depth of 540m in the northern hemisphere Small basin (NHSB). The leading mode of SST variability is observed to be an east-west dipole centered at 60oN. Analysis of the power spectrum time series shows a clear peak at a period of around 33 years (Figure 3).
Mechanism of SST Variability
The SST anomalies are observed to be associated with deep thermal anomalies that are created by anomalous advection of heat by ocean currents.
The above movie shows an east-west section of potential temperature anomalies and associated air-sea heat flux anomalies (positive, upward) through 60oN in the NHSB. The movie reveals the evolution of temperature anomalies originating near the eastern boundary which strengthen as they propagate westward as thermal Rossby waves. Comparison of the location of air-sea heat flux anomalies with the location of the temperature anomalies in the model ocean suggests that the temperature anomalies are damped by air-sea heat fluxes at all stages in their evolution.
Decadal MOC Variability in Small Basin
The above movie shows: (top left) subsurface temperature anomalies, (top-right) an east-west section of potential temperature at 60oN,(bottom-left) convective index anomalies at 60oN, and (bottom-right) the meridional overturning circulation (MOC) at 60oN in the NHSB. Besides showing the temperature anomalies propagating westwards, the movie also shows that warm (cold) anomalies on the eastern boundary are associated with increased (decreased) convection. As temperature anomalies reach the western boundary, they act to spin up the inter-hemispheric MOC.
Mechanism of MOC Variability
Buckley says, “Ocean only experiments demonstrate that the decadal mode of MOC and temperature variability observed in the coupled model is a self-sustained ocean-only mode. No stochastic atmospheric forcing is required to excite the mode, and the variability on decadal timescsales is well reproduced by running an ocean-only model with climatological forcing of heat, momentum, and freshwater as well as realistic damping of SST anomalies”. Buckley and team believe the anomalies are able to overcome dissipation by extracting available potential energy from the mean state via baroclinic instability and are working hard to articulate a generalised theory.
Next steps…
Right now Buckley is testing if the mode of variability is robust to changes in bathymetry. Long term, to test the generality of the team’s idea that thermal Rossby waves excite MOC variability, Buckley plans to analyse a 2000 year run of the GFDL coupled model as well as a (15 year) ECCO run (in which MITgcm is used in a global run constrained by data) for evidence of similar AMOC decadal variability. While Buckley expects some of the features of decadal variability she is finding in her Double Drake model to be artifacts of the configuration’s highly idealised geometry, she is confident the basic process will be identifiable in the more complex GCMs. To find our more about this work contact Martha…

Martha has been using MITgcm since 2006. She is currently in her 5th year as a graduate student working with John Marshall. In her spare time she enjoys competitive cycling – click on her picture to see her in action…
References:
Ferreira, D., J. Marshall, and J.-M. Campin, 2010: Localization of Deep Water Formation: Role of Atmospheric Moisture Transport and Geometrical Constraints on Ocean Circulation. J. Climate. 23, 1456-1476

