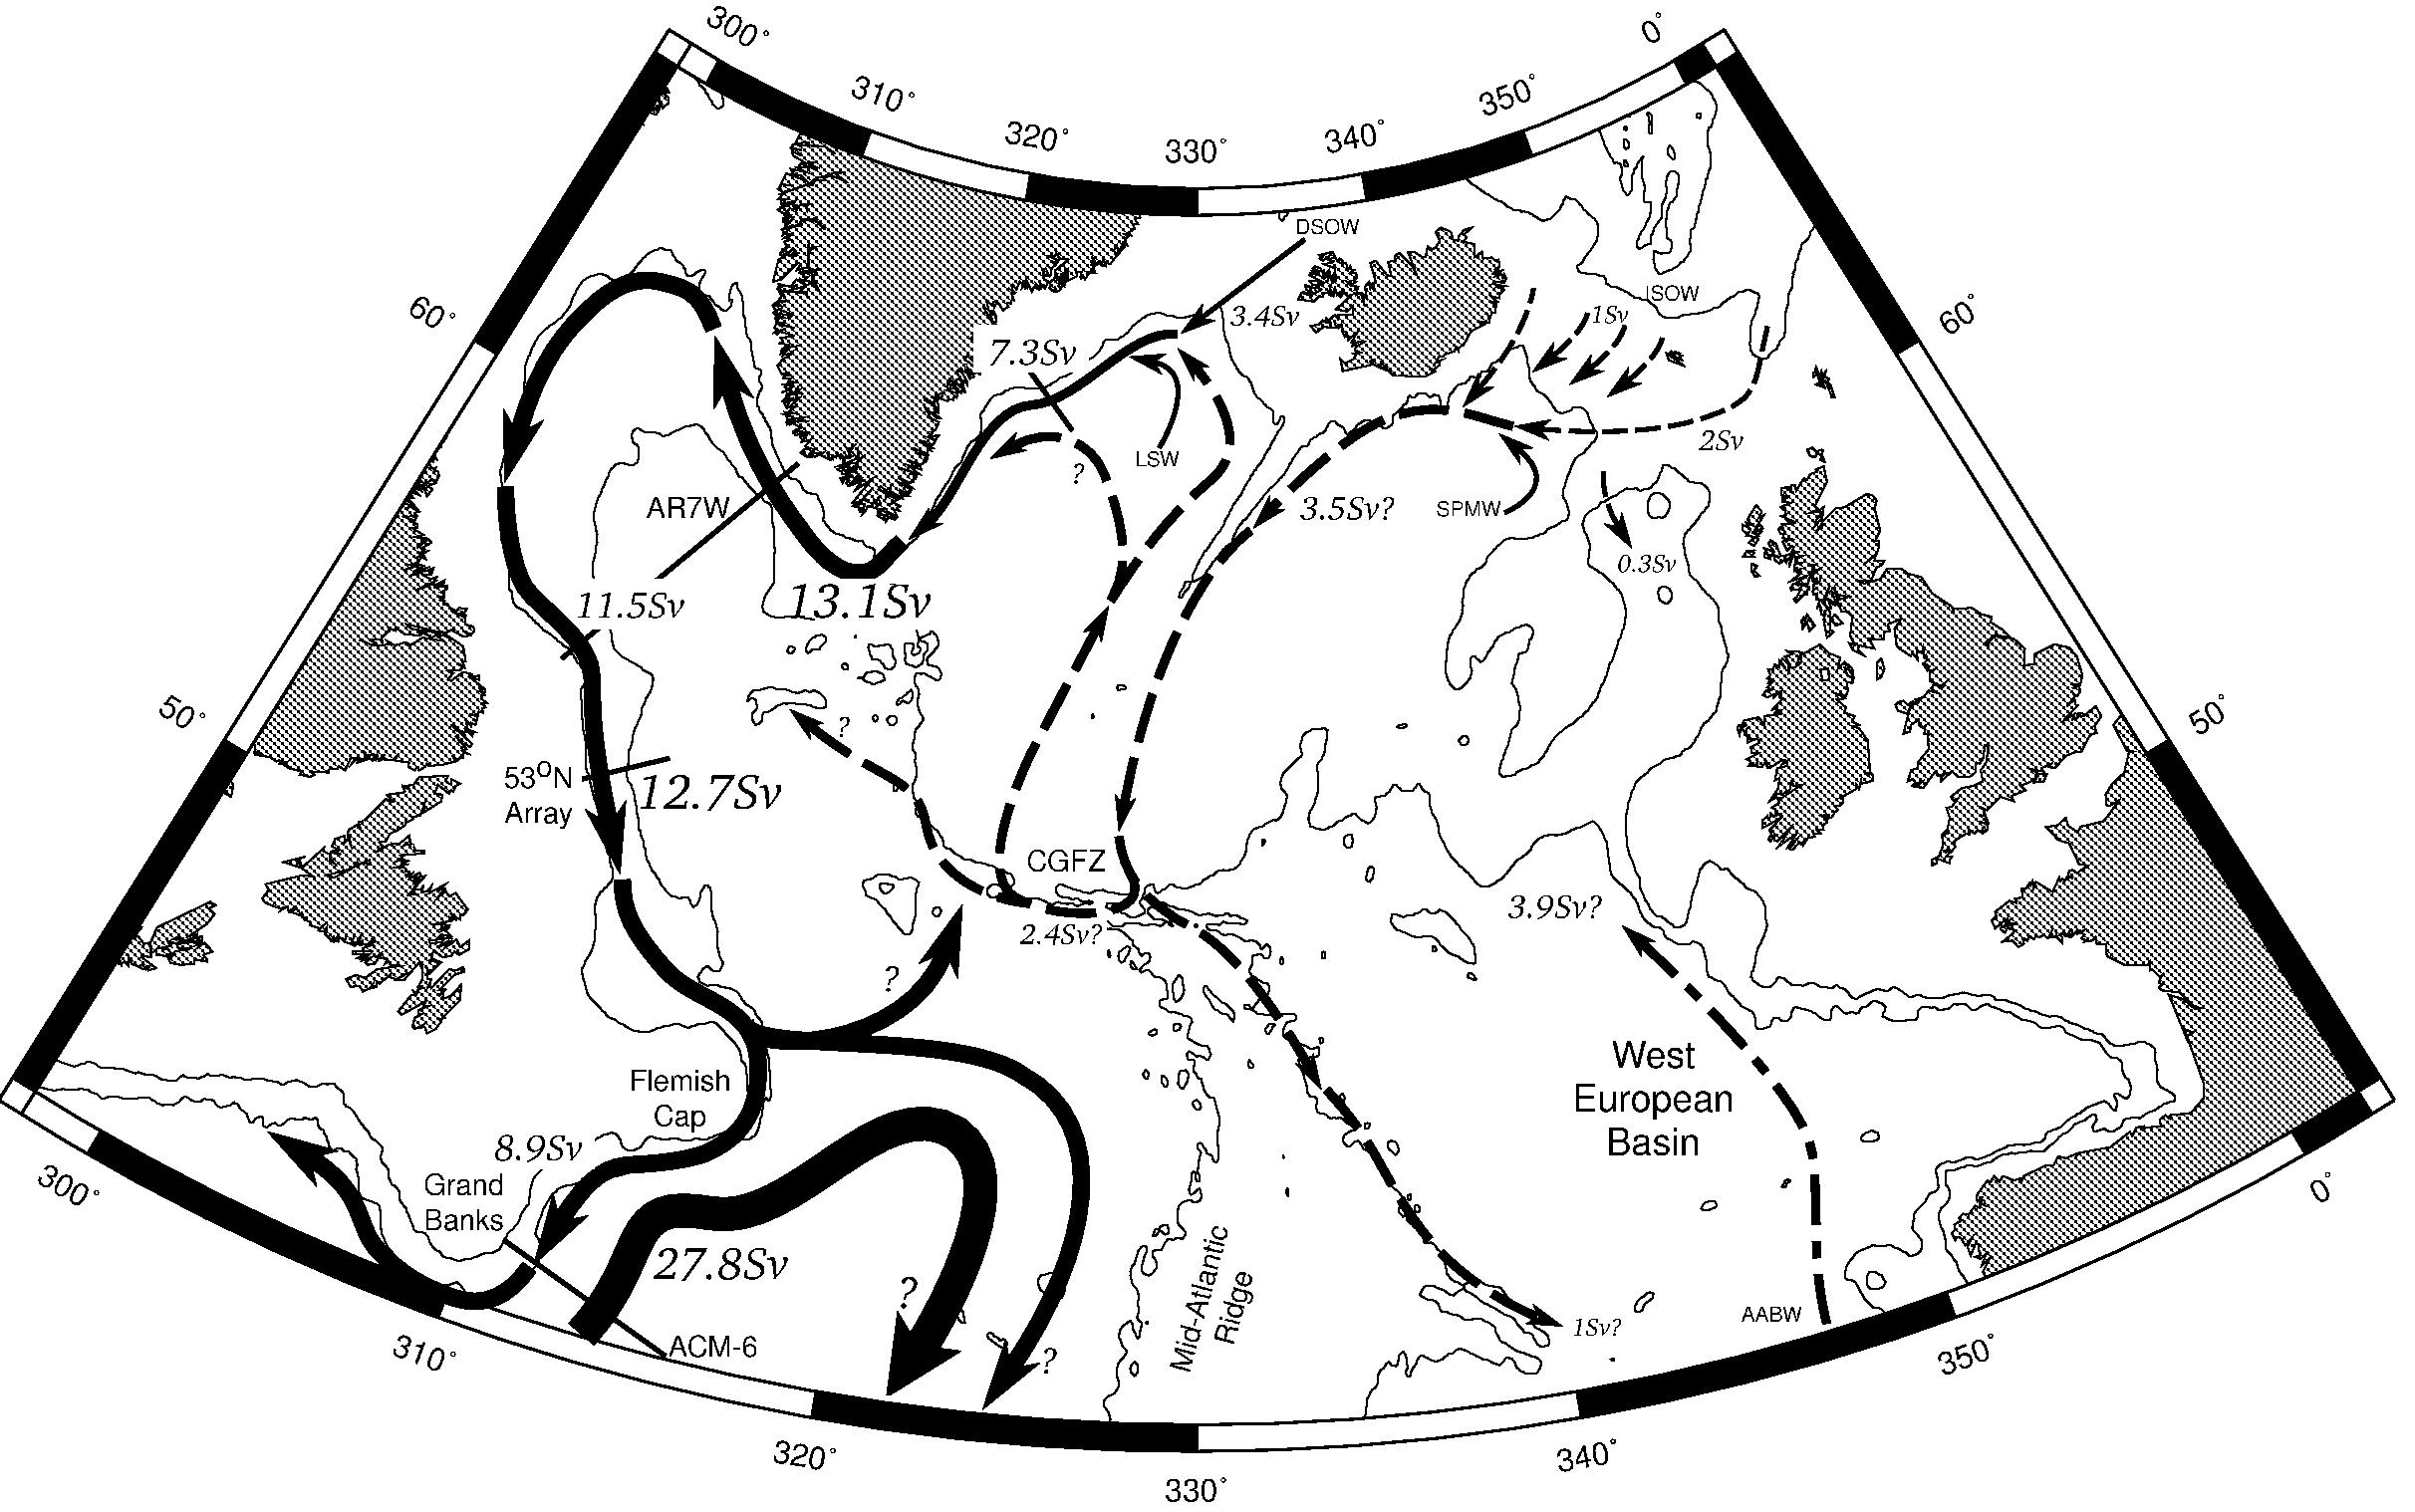
This month we look at work by Tom Haine, Professor of Physical Oceanography at Johns Hopkins University who is using MITgcm to model the flow through the Denmark Strait.
In a paper published last Fall (Haine et al, 2009 – included in last year’s MITgcm Research Round-Up), Haine and collaborators presented work exploring the impact of high-resolution, high-frequency meteorological forcing on the Denmark Strait circulation. Focusing on the month of the Greenland Flow Distortion experiment (GFDex), they forced their MITgcm based ocean with atmospheric states from reanalysis products having significantly different spatial and temporal resolutions. Taking the 2.5 degree, 6 hourly NCEP reanalysis data as their source of “low resolution” atmospheric forcing data and output from a specially configured regional atmospheric model having 12km resolution and hourly output as their “high resolution” source, Haine and co-authors were able to show that even while the hydrographic state of the model showed itself to be insensitive to the choice of atmospheric model for the duration of the experiment, the small-scale variability in the high-resolution atmospheric model led to significant differences in upper-ocean currents and mixing between the two experiments. Since then he and his team have been studying high-frequency fluctuations in transport through the strait to assess whether the surface signal is sufficiently strong to be reliably interpreted from satellite data enabling remote, long term monitoring (Haine, 2010).
As the primary conduit for cold, dense, high-latitude outflow in the northern hemisphere, understanding the Denmark Strait Overflow is seen as a key element in understanding the global ocean overturning circulation. Multiple observed changes in the marine environment of the North Atlantic over recent years (IPCC, 2007), suggest that monitoring transport through the strait may be an important tool in understanding this part of the Earth climate.
The Model
Haine’s model grid consists of 540 x 360 cells in longitude and latitude with a variable spacing ranging from 1.7km in the domain center to 12km at the edge. With 97 levels in the vertical, 2m thick at the surface, increasing to a thickness of 200m at 3300m, the model has 58 levels in the upper 1000m and 87 levels in the upper 2000m. The bathymetry is an interpolation from the (2.5km resolution) International Bathymetric Chart of the Arctic Ocean (Jakobsson et al, 2000).
Using MITgcm’s r* coordinate in the vertical (Adcroft and Campin, 2004), a nonlinear free surface (Campin et al, 2004), and lopped-cells (Adcroft et al., 1997), advection of temperature and salinity is computed using a third-order direct space-time flux-limited scheme, with an equation of state based on Jackett and McDougall (1995). The model includes boundary layer parameterizations (Large et al, 1994) and Leith’s (1968) parameterization for viscous dissipation from unresolved scales. Sea ice thermodynamics are represented by Hibler’s 1980 two-category model, which simulates sea ice concentration and thickness fields. Snow is represented by the Zhang et al (1999) model.
Employing the hydrostatic form of MITgcm (including non-hydrostatic terms was found to make an insignificant difference to the solution), the model uses zero explicit diffusivity of heat or salt, free-slip side wall boundary conditions, and a no-slip bottom boundary condition with a quadratic drag law (coefficient 0.001). For full details see Haine et al 2009.
Simulation of the Overflow
The Denmark Strait transport has been observed to exhibit quasi-regular fluctuations immediately south of the sill with periods of 2-4 days and a transport variability similar to the mean transport itself.
The above movie shows the time-variation of the dense overflow Haine’s observes. Beginning by presenting the time-varying sea-surface (in brown), clearly visible is the train of cyclones kicked off by passage over the sill. As time proceeds the projection shifts to reveal the evolution of the dense overflow (in green) underneath. The movie spans two months in Fall 2004. The location and orientation of the Denmark Strait sill is identified by the blue plane (initially apparent as a line segment) towards the center of the domain. Read more about this work in Haine 2010…
Publications:
Haine, T.W.N., 2010, High-Frequency Fluctuations in Denmark Strait Transport, Geophysical Research Letters, Vol. 37, L14601, 5 PP., 2010 (doi: 10.1029/2010GL043272)
Haine, T.W.N., S. Zhang, G.W.K. Moore, and I.A. Renfrew, 2009, On the impact of high resolution, high-frequency meteorological forcing on Denmark Strait ocean circulation, Q.J.R. Meteorol. Soc., 135, 2067-2085 (doi:10.1002/qj.505)
MITgcm References:
Adcroft A. and Campin J-M, 2004, Rescaled height coordinates for accurate representation of free-surface flows in ocean circulation models, Ocean Modelling 7: 269-284. (doi:10.1016/j.ocemod.2003.09.003)
Campin J-M, A. Adcroft, C. Hill, and J. Marshall, 2004, Conservation of Properties in a Free-Surface Model, Ocean Modeling 6, 221-284. (doi:10.1016/S1463-5003(03)00009-X)
Adcroft A., C. Hill and J. Marshall, 1997, Representation of topography by shaved cells in a height coordinate ocean model, Mon. Weather Rev. 125: 2293-2315.(doi:10.1175/1520-0493(1997)125<2293:ROTBSC>2.0.CO;2)


