Lake Modeling
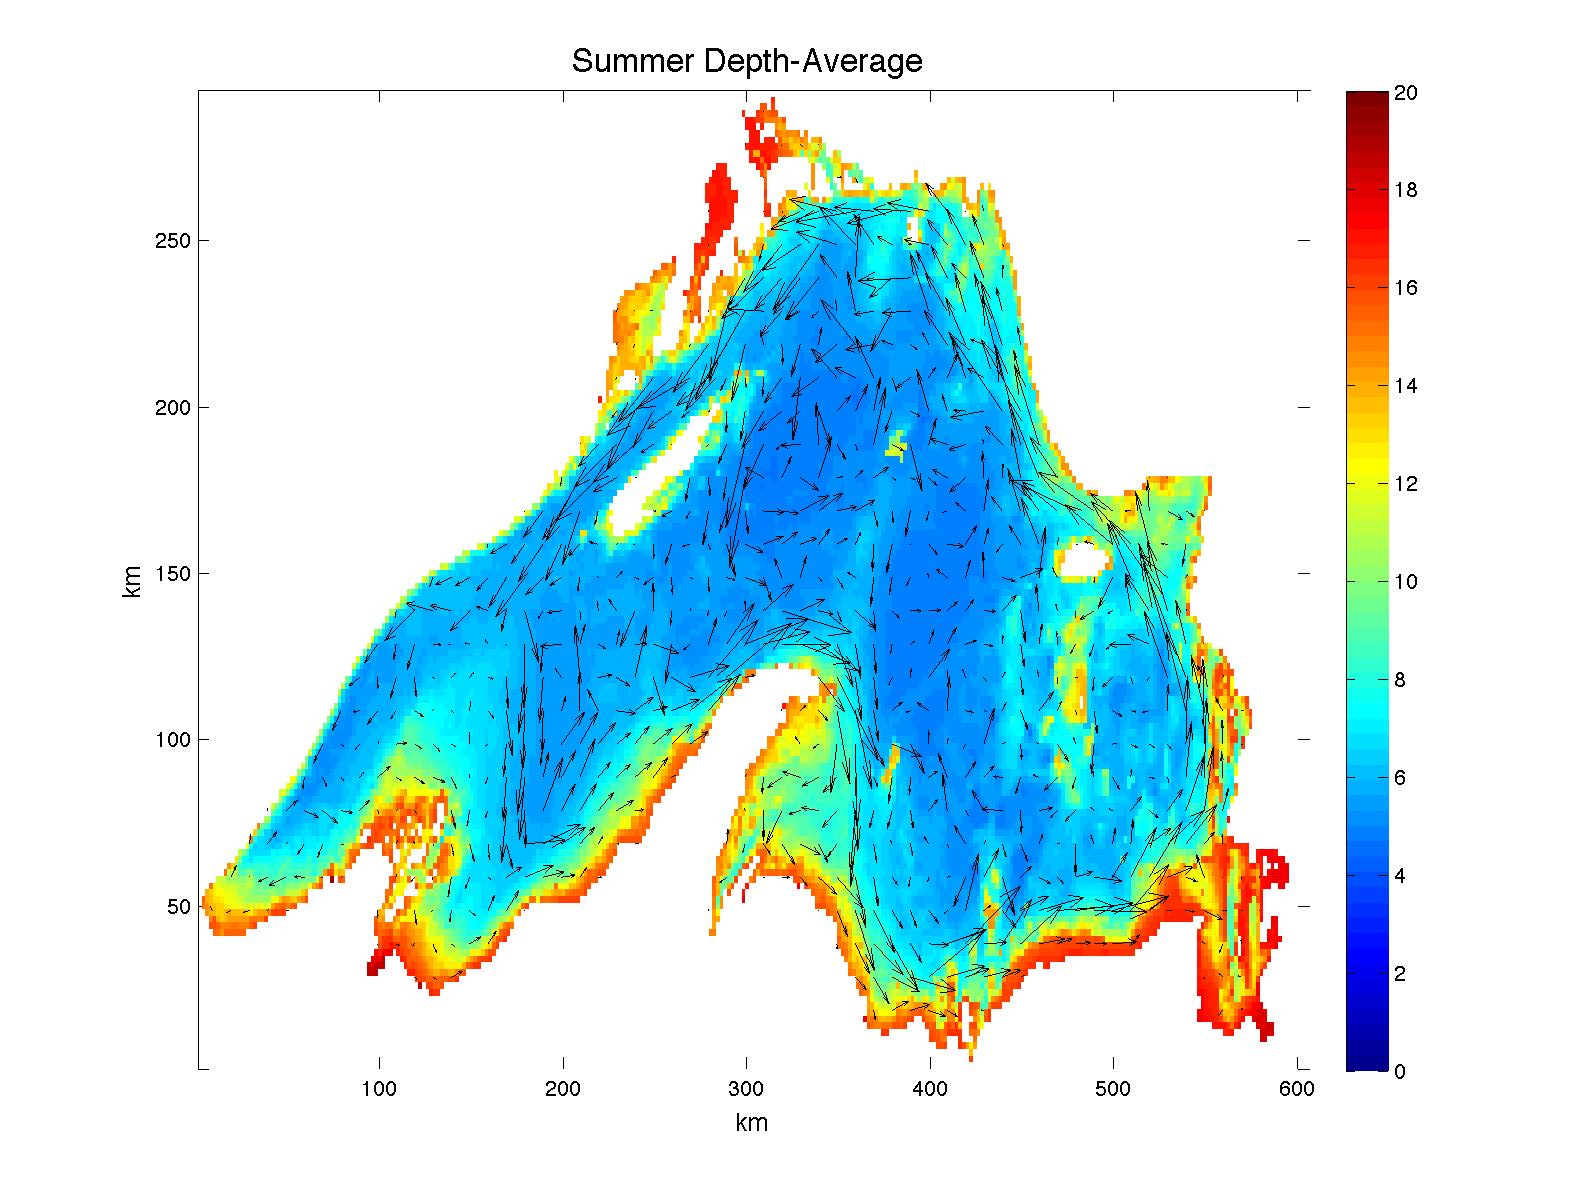
Work by Galen McKinley and Val Bennington at the University of Wisconsin, Madison using MITgcm to model the general circulation of Lake Superior as part of a project to develop a quantitative understanding of the role such bodies of water may play in the terrestrial carbon cycle…
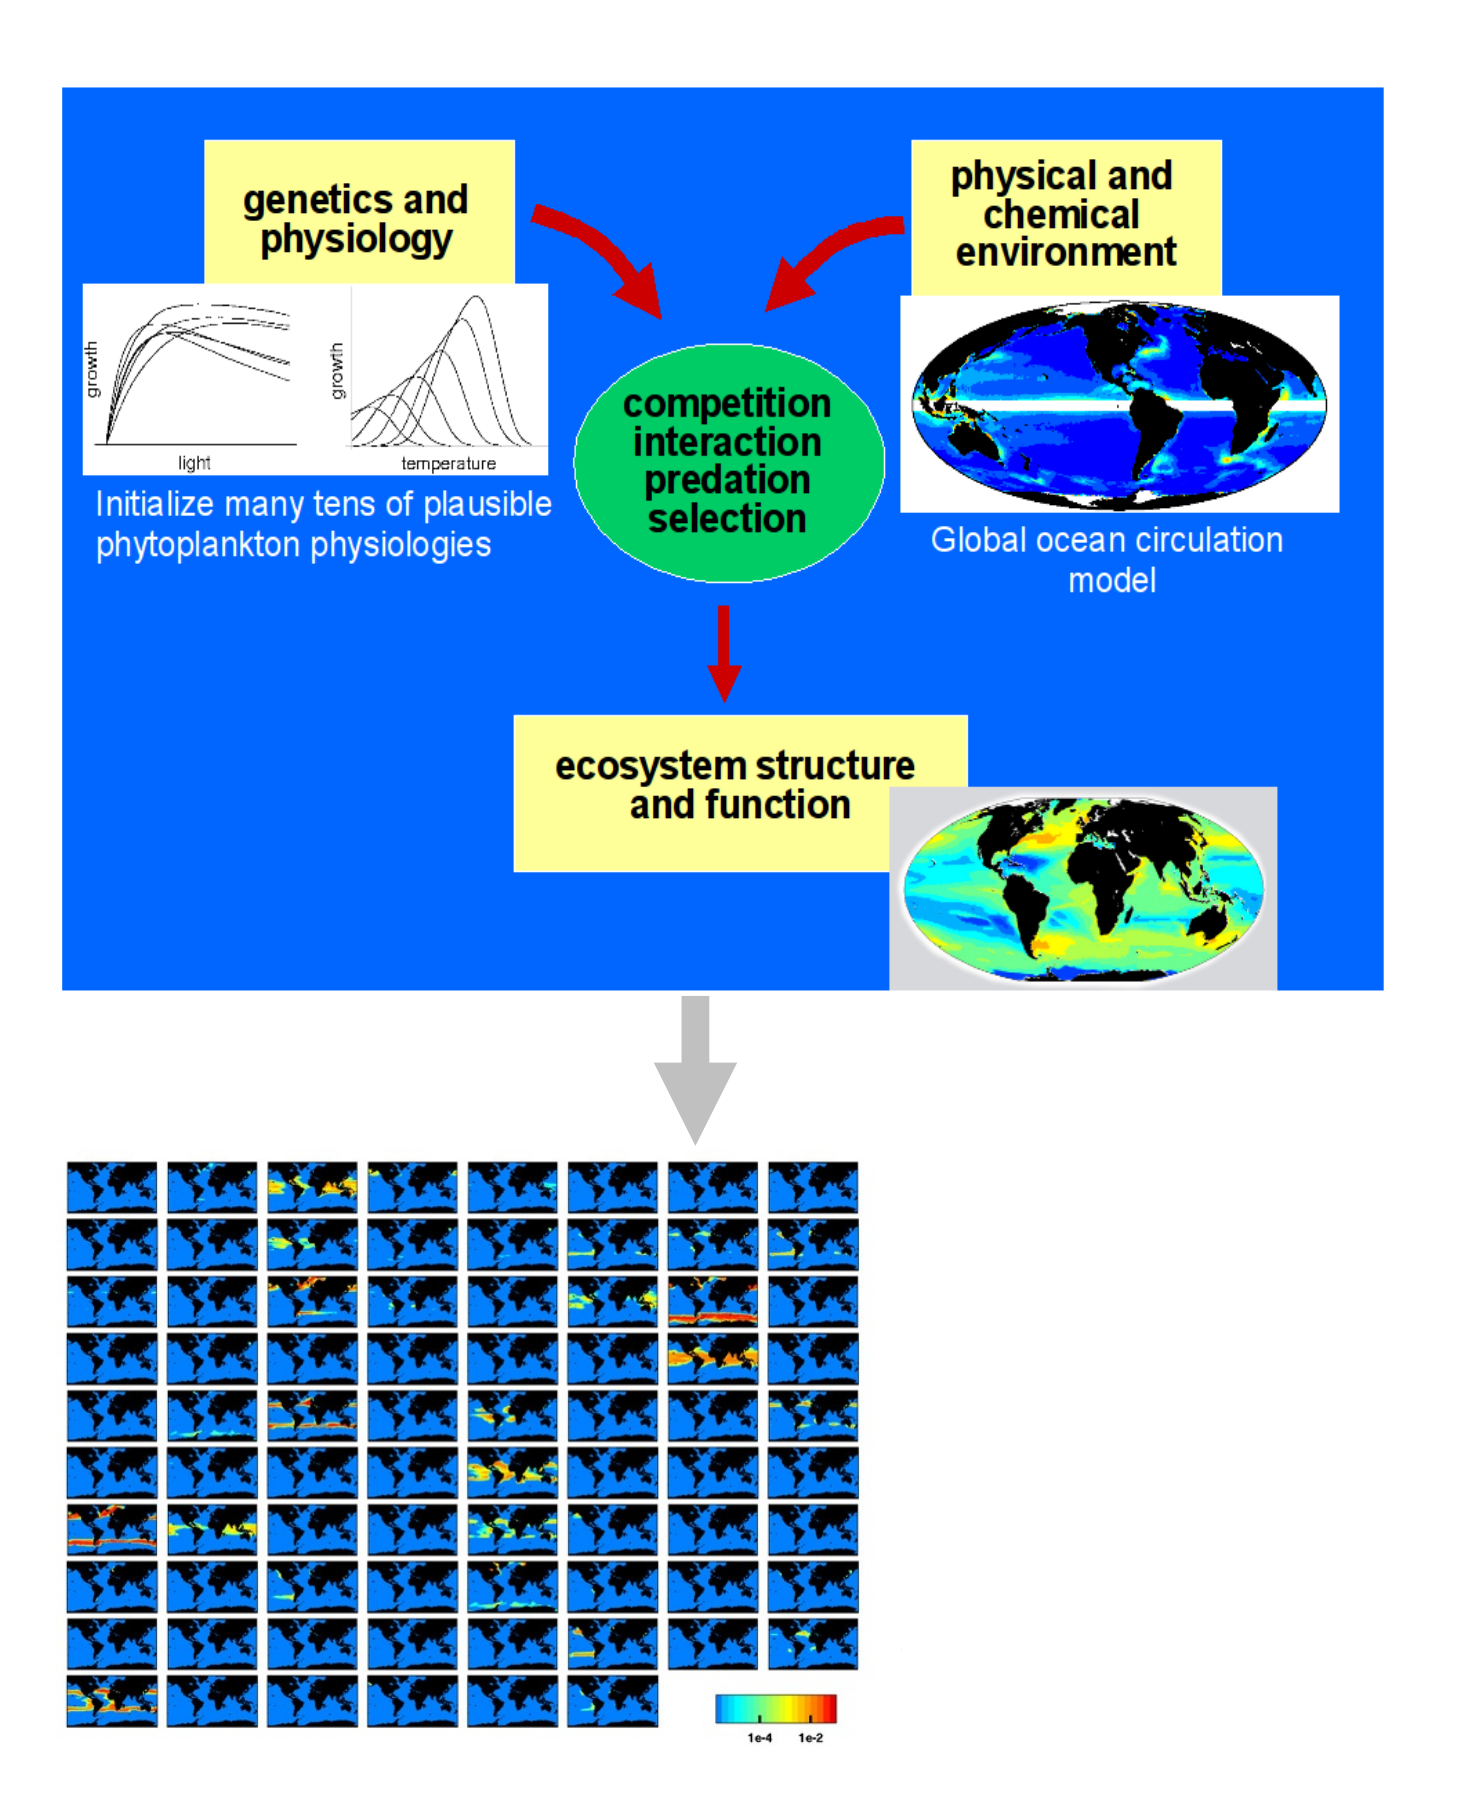
Ocean Ecosystems
 Work by Fanny Monteiro with Mick Follows and Stephanie Dutkiewicz at MIT who have been using the MITgcm to probe the behaviour of self-assembling phytoplankton communities within a global ocean circulation…

