Slip Sliding Away…
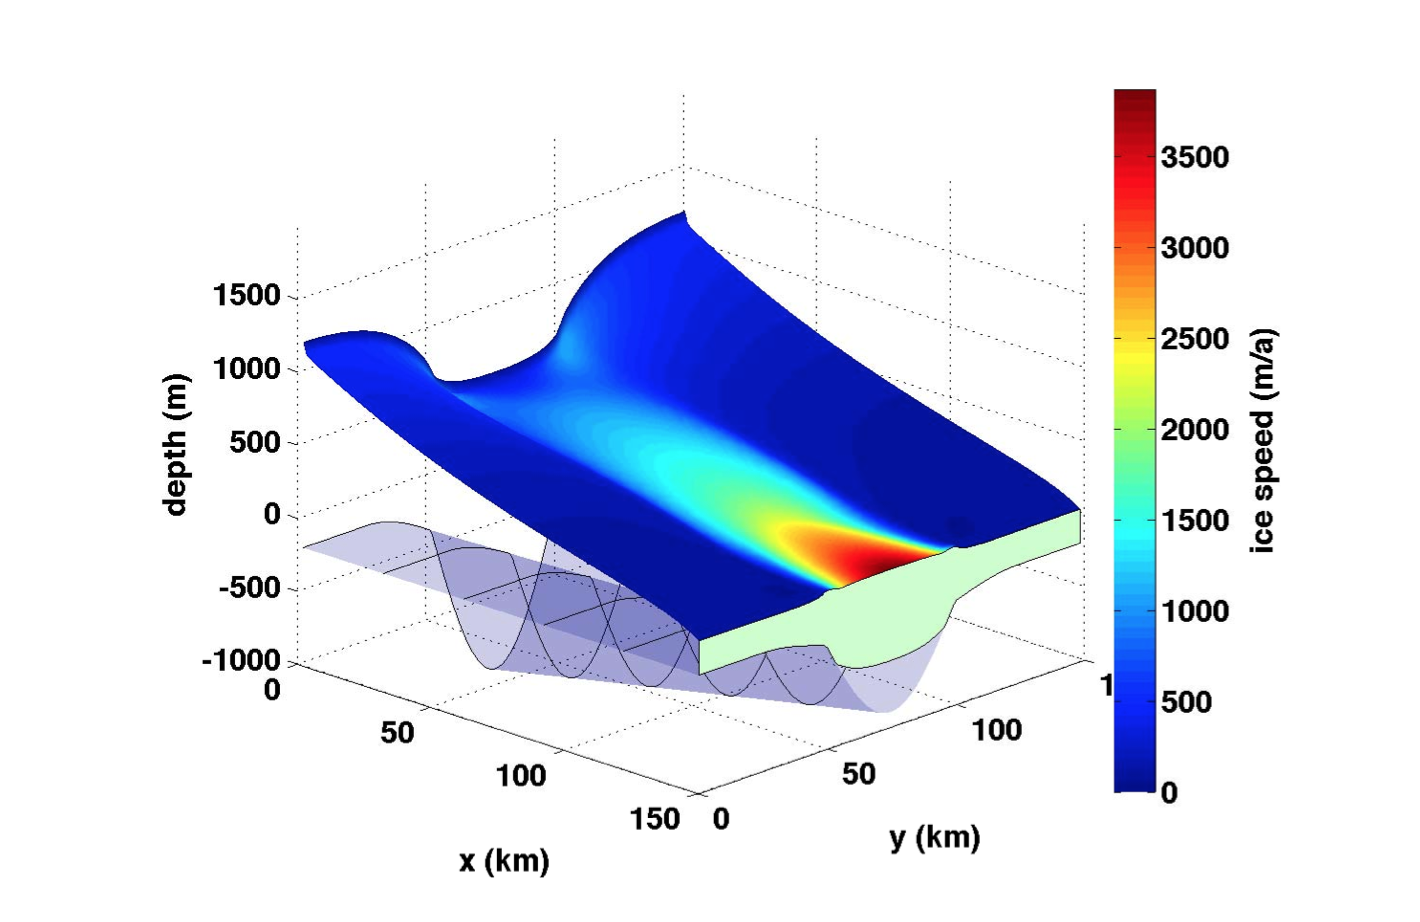 Dan Goldberg has been working with longtime MITgcmer Patrick Heimbach, looking at new ways to assimilate observations into glaciological flow models capable of representing fast streaming ice flow.
Looping the loop in the Gulf of Mexico
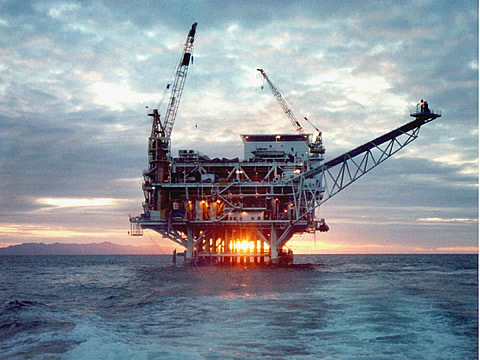 This month we focus on several recent papers that have used MITgcm and its adjoint to perform state estimates and explore its ocean forecasting capabilities in the Gulf of Mexico.
Under the Ice
![]() In a new paper published in the Annals of Glaciology, long-time MITgcm users Patrick Heimbach and Martic Losch investigate the sensitivity of sub-ice-shelf melt rates under the Pine Island Ice Shelf, West Antarctica, to changes in the oceanic state.
In a new paper published in the Annals of Glaciology, long-time MITgcm users Patrick Heimbach and Martic Losch investigate the sensitivity of sub-ice-shelf melt rates under the Pine Island Ice Shelf, West Antarctica, to changes in the oceanic state.
Adjoint approaches to assessing local vulnerability to buoyant surface plumes
![]() Prompted by the recent spill in the Gulf of Mexico, Ross Tulloch, Chris Hill and Oliver Jahn have been using MITgcm to compute the vulnerability of individual locations to remote buoyant surface plumes.
Prompted by the recent spill in the Gulf of Mexico, Ross Tulloch, Chris Hill and Oliver Jahn have been using MITgcm to compute the vulnerability of individual locations to remote buoyant surface plumes.
OCCA
 This month we focus on work by Gael Forget and the ECCO team who have been using MITgcm to construct a new ocean atlas. By using MITgcm as a means of optimally synthesising data within the framework of a physically accurate general circulation model, OCCA (short for OCean Comprehensible Atlas) provides a singularly accurate 3-year “snap-shot” of the global ocean state for the period December 2003 to November 2006…
Anthropogenic CO2 transport in the Southern Ocean.
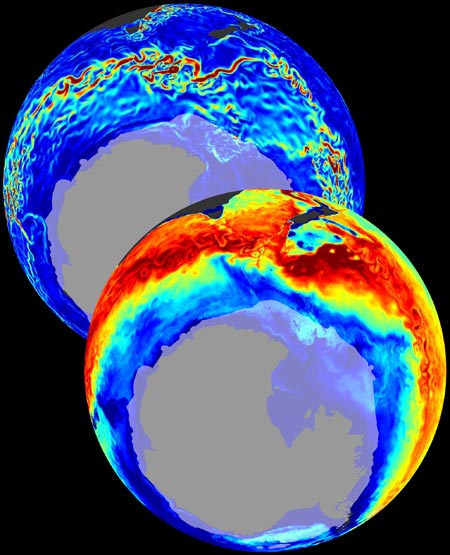 Taka Ito, Molly Woloszyn and Matt Mazloff have been studying anthropogenic CO2 transport in the Southern Ocean. Using MITgcm’s adjoint and offline capabilities, the team find a clear correlation between the pattern of carbon uptake and oceanic vertical exchange in strong support of wind-driven primary regulation of Southern Ocean ACO2 transport…
Sea Ice
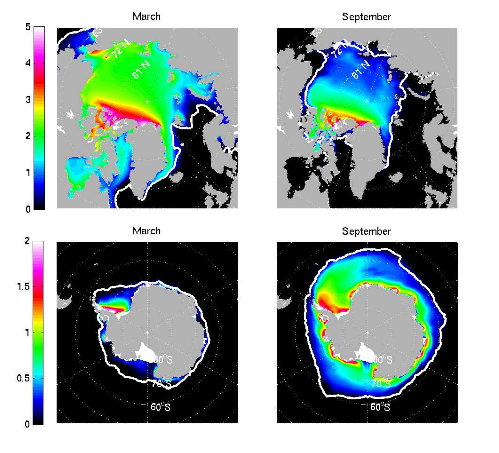 Work by Martin Losch of the Alfred-Wegener-Institute, Bremerhaven, Germany, Jean Michel Campin, Patrick Heimbach, Chris Hill (at MIT) and Dimitris Menemenlis (JPL) extending the reach of the MITgcm in to the Polar oceans, with the development of a dynamic-thermodynamic sea-ice model and its adjoint…
Adjoint Advances
Adjoint Advances story by Helen Hill Two MITgcm adjoint activities are (i) the development of an open-source, extensible automatic differentiation tool, OpenAD and (ii) the configuration of an ~18km resolution global ocean and sea-ice experiment as part of the ECCO2 project.
Sea-ice donuts
The MITgcm is now able to generate Sea-Ice Donuts.
